Как закрасить метки дендрограммы дополнительной факторной переменной в R
Я создал дендрограмму после запуска анализа иерархической кластеризации в R с использованием приведенного ниже кода. Сейчас я пытаюсь раскрасить метки в соответствии с другой факторной переменной, которая сохраняется как вектор. Самое близкое к этому достижение - это раскрасить ветви с помощью ColourDendrogram функция в sparcl пакет. Если возможно, я бы предпочел раскрасить этикетки. Я нашел ответы на аналогичные вопросы по следующим ссылкам. Цвет ветвей дендрограммы с использованием существующего столбца и Цвет ветвей дендрограммы в R, но я не смог понять, как преобразовать пример кода для моих целей. Ниже приведен пример данных и кода.
> dput(df)
structure(list(labs = c("a1", "a2", "a3", "a4", "a5", "a6", "a7",
"a8", "b1", "b2", "b3", "b4", "b5", "b6", "b7"), var = c(1L,
1L, 2L, 1L, 2L, 2L, 1L, 2L, 1L, 2L, 1L, 1L, 2L, 2L, 2L), td = c(13.1,
14.5, 16.7, 12.9, 14.9, 15.6, 13.4, 15.3, 12.8, 14.5, 14.7, 13.1,
14.9, 15.6, 14.6), fd = c(2L, 3L, 3L, 1L, 2L, 3L, 2L, 3L, 2L,
4L, 2L, 1L, 4L, 3L, 3L)), .Names = c("labs", "var", "td", "fd"
), class = "data.frame", row.names = c(NA, -15L))

df.nw = df[,3:4]
labs = df$labs

d = dist(as.matrix(df.nw))                          # find distance matrix
hc = hclust(d, method="complete")                   # apply hierarchical clustering
plot(hc, hang=-0.01, cex=0.6, labels=labs, xlab="") # plot the dendrogram

hcd = as.dendrogram(hc)                             # convert hclust to dendrogram
plot(hcd, cex=0.6)                                  # plot using dendrogram object

Var = df$var                                        # factor variable for colours
varCol = gsub("1","red",Var)                        # convert numbers to colours
varCol = gsub("2","blue",varCol)

# colour-code dendrogram branches by a factor
library(sparcl)
ColorDendrogram(hc, y=varCol, branchlength=0.9, labels=labs,
                xlab="", ylab="", sub="")
Любой совет о том, как это сделать, будет принята с благодарностью.
2 ответа
Пытаться
# ... your code
colLab <- function(n) {
  if(is.leaf(n)) {
    a <- attributes(n)
    attr(n, "label") <- labs[a$label]
    attr(n, "nodePar") <- c(a$nodePar, lab.col = varCol[a$label])
  }
  n
}
plot(dendrapply(hcd, colLab))
( через)
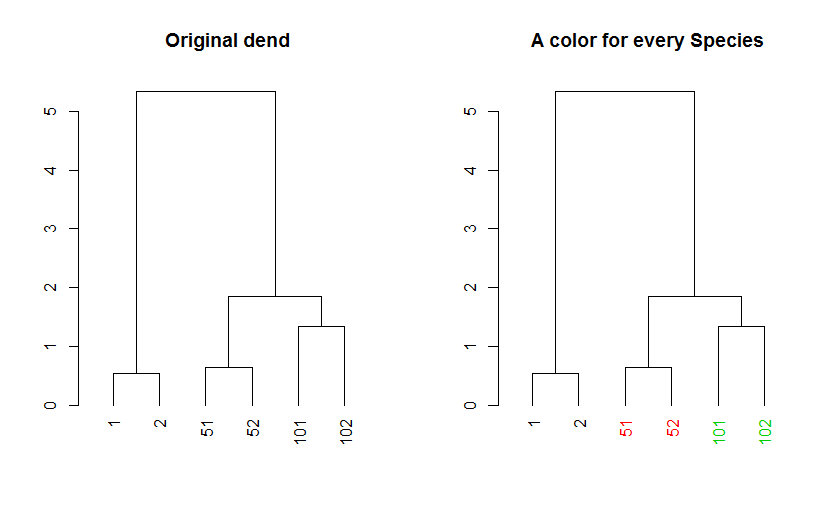
Для окрашивания ваших этикеток было бы проще всего использовать labels_colors функция из пакета dendextend. Например:
# install.packages("dendextend")
library(dendextend)

small_iris <- iris[c(1, 51, 101, 2, 52, 102), ]
dend <- as.dendrogram(hclust(dist(small_iris[,-5])))
# Like:
# dend <- small_iris[,-5] %>% dist %>% hclust %>% as.dendrogram

# By default, the dend has no colors to the labels
labels_colors(dend)
par(mfrow = c(1,2))
plot(dend, main = "Original dend")

# let's add some color:
colors_to_use <- as.numeric(small_iris[,5])
colors_to_use
# But sort them based on their order in dend:
colors_to_use <- colors_to_use[order.dendrogram(dend)]
colors_to_use
# Now we can use them
labels_colors(dend) <- colors_to_use
# Now each state has a color
labels_colors(dend)
plot(dend, main = "A color for every Species")
Для более подробной информации о пакете, вы можете взглянуть на его виньетка.
