Сложенная гистограмма с иерархической кластеризацией (дендрограмма)
3 ответа
Вот моя версия скрипта Roman_G. Оно использует
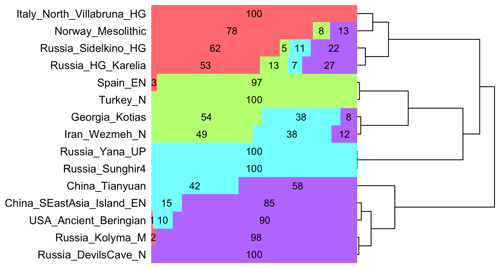
vegan::reorder.hclust изменить порядок ветвей дендрограммы так, чтобы строки с наивысшим значением для первого столбца располагались вверху, а строки с наивысшим значением для последнего столбца - внизу.
      library(tidyverse)
library(ggdendro)
library(vegan)
library(colorspace)
library(cowplot)

t=read.table(text="Spain_EN 0.028152 0.971828 0.000010 0.000010
Norway_Mesolithic 0.784705 0.083387 0.000010 0.131898
Russia_Sunghir4 0.000010 0.000010 0.999970 0.000010
Iran_Wezmeh_N 0.000010 0.492331 0.383227 0.124433
Russia_DevilsCave_N 0.000010 0.000010 0.000010 0.999970
Italy_North_Villabruna_HG 0.999970 0.000010 0.000010 0.000010
Russia_HG_Karelia 0.527887 0.133179 0.072342 0.266593
Russia_Yana_UP 0.000010 0.000014 0.999966 0.000010
Georgia_Kotias 0.000010 0.537322 0.381313 0.081355
China_SEastAsia_Island_EN 0.000010 0.000010 0.148652 0.851328
Turkey_N 0.000010 0.999970 0.000010 0.000010
USA_Ancient_Beringian 0.008591 0.000010 0.095008 0.896391
Russia_Sidelkino_HG 0.624076 0.045350 0.105615 0.224958
Russia_Kolyma_M 0.020197 0.000010 0.000010 0.979783
China_Tianyuan 0.000010 0.000010 0.423731 0.576249",row.names=1)

hc=hclust(dist(t),method="ward.D2")
hc=reorder(hc,wts=-as.matrix(t)%*%seq(ncol(t))^2) # vegan::reorder.hclust
tree=ggdendro::dendro_data(as.dendrogram(hc),type="rectangle")

p1=ggplot(ggdendro::segment(tree))+
geom_segment(aes(x=y,y=x,xend=yend,yend=xend),lineend="round",size=.4)+
scale_x_continuous(expand=expansion(add=c(0,.01)))+ # don't crop half of line between top-level nodes
scale_y_continuous(limits=.5+c(0,nrow(t)),expand=c(0,0))+
theme(
  axis.text=element_blank(),
  axis.ticks=element_blank(),
  axis.ticks.length=unit(0,"pt"), # remove extra space occupied by ticks
  axis.title=element_blank(),
  panel.background=element_rect(fill="white"),
  panel.grid=element_blank(),
  plot.margin=margin(5,5,5,0)
)

t=t[hc$labels[hc$order],]
t2=data.frame(V1=rownames(t)[row(t)],V2=colnames(t)[col(t)],V3=unname(do.call(c,t)))
lab=round(100*t2$V3)
lab[lab==0]=""

p2=ggplot(t2,aes(x=factor(V1,level=rownames(t)),y=V3,fill=V2))+
geom_bar(stat="identity",width=1,position=position_fill(reverse=T))+
geom_text(aes(label=lab),position=position_stack(vjust=.5,reverse=T),size=3.5)+
coord_flip()+
scale_x_discrete(expand=c(0,0))+
scale_y_discrete(expand=c(0,0))+
scale_fill_manual(values=colorspace::hex(HSV(head(seq(0,360,length.out=ncol(t)+1),-1),.5,1)))+
theme(
  axis.text=element_text(color="black",size=11),
  axis.text.x=element_blank(),
  axis.ticks=element_blank(),
  axis.title=element_blank(),
  legend.position="none",
  plot.margin=margin(5,0,5,5)
)

cowplot::plot_grid(p2,p1,rel_widths=c(1,.4))
ggsave("a.png",height=.25*nrow(t),width=7)

Есть также
scale_x_dendrogram а также
scale_y_dendrogram из
ggh4x, которые используют
ggdendro::dendro_data: https://teunbrand.github.io/ggh4x/articles/PositionGuides.html#dendrograms . Однако я не мог заставить их работать с горизонтальными столбцами, сложенными с помощью
coord_flip.
      library(ggh4x)

t=head(USArrests,20)
t2=data.frame(V1=rownames(t)[row(t)],V2=colnames(t)[col(t)],V3=unname(do.call(c,t)))
hc=hclust(dist(t))

ggplot(t2,aes(x=factor(V1,level=rownames(t)),y=V3,fill=V2))+
geom_bar(stat="identity",width=1,position=position_stack(reverse=F))+
geom_text(aes(label=round(V3)),position=position_stack(vjust=.5,reverse=F),size=3)+
scale_x_dendrogram(hclust=hc)+
scale_y_discrete(expand=c(0,0))+
# scale_fill_manual(values=colorspace::hex(HSV(head(seq(0,360,length.out=ncol(t)+1),-1),.5,1)))+
theme(
  axis.text=element_text(color="black",size=11),
  axis.text.x=element_text(angle=90,hjust=1,vjust=.5),
  axis.text.y=element_blank(),
  axis.ticks=element_blank(),
  axis.ticks.length=unit(14,"pt"), # height of dendrogram
  axis.title=element_blank(),
  legend.justification=c(0,1),
  legend.key=element_rect(fill=NA), # remove gray border around color squares
  legend.margin=margin(-6,0,0,0),
  legend.position=c(0,1),
  legend.title=element_blank(),
  panel.background=element_rect(fill="white"),
  plot.margin=margin(5,0,5,5)
)

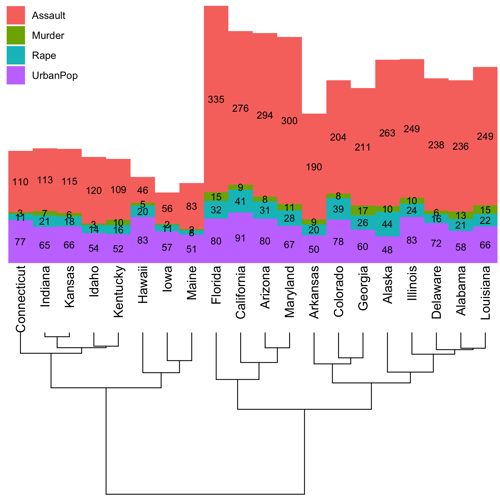
ggsave("a.png",height=6,width=6)

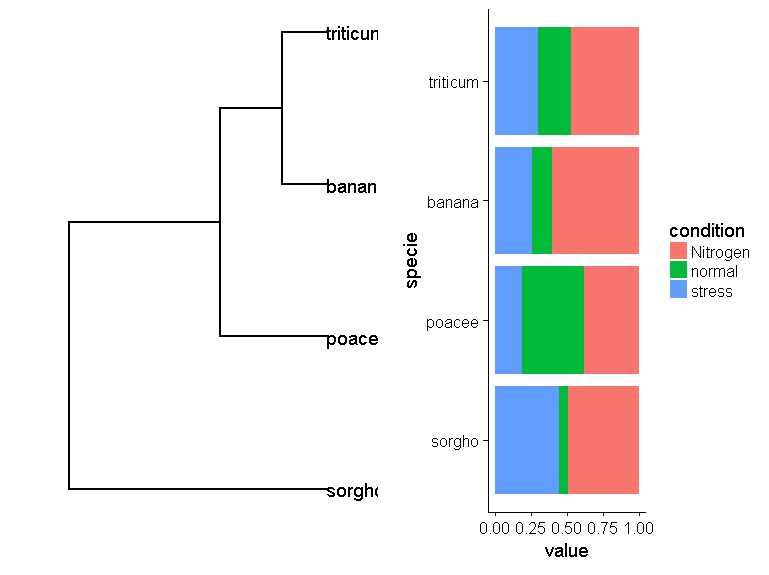
Первый удар по ответу - но для того, чтобы он действительно работал, потребовалось бы больше работы. В частности, о расположении элементов (а также их порядке) необходимо подумать более тщательно.
# library
library(ggplot2)

# create a dataset
specie=c(rep("sorgho" , 3) , rep("poacee" , 3) , rep("banana" , 3) , rep("triticum" , 3) )
condition=rep(c("normal" , "stress" , "Nitrogen") , 4)
value=abs(rnorm(12 , 0 , 15))
data=data.frame(specie,condition,value)


dend <- as.dendrogram(hclust(dist(with(data, tapply(value, specie, mean)))))

data$specie <- factor(data$specie, levels = labels(dend))

# Stacked Percent
library(dendextend)
p1 <- ggplot(dend, horiz = T)
p2 <- ggplot(data, aes(fill=condition, y=value, x=specie)) +
    geom_bar( stat="identity", position="fill") + coord_flip()

library(cowplot)
plot_grid(p1, p2, align = "h")
Спустя почти три года до сих пор нет пакета, способного комбинировать составные гистограммы с иерархической кластеризацией в ggplot (по крайней мере, что я знаю). Вот мое решение, основанное на том сообщении, объединяющем дендрограмму и тепловую карту:
library(tidyverse)
library(phangorn)
library(vegan)
library(ggdendro)
library(dendextend)
library(ggsci)
library(cowplot)

## generate example data ####
set.seed(500)
combined_matrix <- data.frame(a=runif(14, 0, 33), b=runif(14, 0, 33), c=runif(14, 0, 33))
combined_matrix$d <- 100 - combined_matrix$a - combined_matrix$b - combined_matrix$c
row.names(combined_matrix) <- paste0("s", seq(1,14))

# vegan::vegdist() to calculate Bray-Curtis distance matrix
dm <- vegdist(combined_matrix, method = "bray")
# calculate UPGMA tree with phangorn::upgma() and convert to dendrogram
dendUPGMA <- as.dendrogram(upgma(dm))
plot_dendro_bars_v <- function(df, dend, taxonomy) {
  #convert dendrogram to segment data
  dend_data <- dendro_data(dend, type="rectangle")
  segment_data <- dend_data[["segments"]]
  #sample positions df
  sample_pos_table <- with(dend_data$labels,
                           data.frame(x_center = x, sample = as.character(label), width = 0.9))
  #prepare input data
  ptdf <- rownames_to_column(df, var = "sample") %>%
    pivot_longer(-sample, names_to = taxonomy, values_to = "Frequency") %>%
    group_by(sample) %>%
    mutate(Frequency = Frequency/100,
           ymax = cumsum(Frequency/sum(Frequency)),
           ymin = ymax - Frequency/sum(Frequency),
           y_center = ymax-(Frequency/2)) %>%
    left_join(sample_pos_table) %>%
    mutate(xmin = x_center-width/2,
           xmax = x_center+width/2)
  #plot stacked bars
  axis_limits <- with(sample_pos_table,
                      c(min(x_center - 0.5 * width), max(x_center + 0.5 * width))) +
    0.1 * c(-1, 1) # extra spacing: 0.1
  plt_hbars <- ggplot(ptdf,
                      aes_string(x = "x_center", y = "y_center", fill = taxonomy, xmin = "xmin", xmax = "xmax",
                                 height = "Frequency", width = "width")) +
    geom_tile() +
    geom_rect(ymin = 0, ymax = 1, color = "black", fill = "transparent") +
    scale_fill_rickandmorty() +
    scale_y_continuous(expand = c(0, 0)) +
    # For the y axis, alternatively set the labels as: gene_position_table$gene
    scale_x_continuous(breaks = sample_pos_table[, "x_center"],
                       labels = sample_pos_table$sample,
                       limits = axis_limits,
                       expand = c(0, 0)) +
    labs(x = "", y = "Frequency") +
    theme_bw() +
    theme(# margin: top, right, bottom, and left
      plot.margin = unit(c(-0.9, 0.2, 1, 0.2), "cm"),
      panel.grid.minor = element_blank())
  #plot dendrogram
  plt_dendr <- ggplot(segment_data) +
    geom_segment(aes(x = x, y = y, xend = xend, yend = yend)) +
    scale_y_continuous(expand = c(0, 0.05)) +
    scale_x_continuous(breaks = sample_pos_table$x_center,
                       labels = rep("", nrow(sample_pos_table)),
                       limits = axis_limits,
                       expand = c(0, 0)) +
    labs(x = "", y = "Distance", colour = "", size = "") +
    theme_bw() +
    theme(panel.grid.minor = element_blank(),
          panel.grid.major = element_blank())
  #combine plots
  comb <- plot_grid(plt_dendr, plt_hbars, align = 'v', ncol = 1, axis = "lr", rel_heights = c(0.3, 1))
  comb
}
plot_dendro_bars_v(df = combined_matrix, dend = dendUPGMA, taxonomy = "example")
или горизонтально
  plot_dendro_bars_h <- function(df, dend, taxonomy) {
  #convert dendrogram to segemnt data
  dend_data <- dendro_data(dend, type="rectangle")
  segment_data <- with(segment(dend_data),
                       data.frame(x = y, y = x, xend = yend, yend = xend))
  #sample positions df
  sample_pos_table <- with(dend_data$labels,
                           data.frame(y_center = x, sample = as.character(label), height = 0.9))
  #prepare input data
  ptdf <- rownames_to_column(df, var = "sample") %>%
    pivot_longer(-sample, names_to = taxonomy, values_to = "Frequency") %>%
    group_by(sample) %>%
    mutate(Frequency = Frequency/100,
           xmax = cumsum(Frequency/sum(Frequency)),
           xmin = xmax - Frequency/sum(Frequency),
           x_center = xmax-(Frequency/2)) %>%
    left_join(sample_pos_table) %>%
    mutate(ymin = y_center-height/2,
           ymax = y_center+height/2)
  #plot stacked bars
  axis_limits <- with(sample_pos_table,
                      c(min(y_center - 0.5 * height), max(y_center + 0.5 * height))) +
    0.1 * c(-1, 1) # extra spacing: 0.1
  plt_hbars <- ggplot(ptdf,
                      aes_string(x = "x_center", y = "y_center", fill = taxonomy, ymin = "ymin", ymax = "ymax",
                                 height = "height", width = "Frequency")) +
    geom_tile() +
    geom_rect(xmin = 0, xmax = 1, color = "black", fill = "transparent") +
    scale_fill_rickandmorty() +
    scale_x_continuous(expand = c(0, 0)) +
    # For the y axis, alternatively set the labels as: gene_position_table$gene
    scale_y_continuous(breaks = sample_pos_table[, "y_center"],
                       labels = rep("", nrow(sample_pos_table)),
                       limits = axis_limits,
                       expand = c(0, 0)) +
    labs(x = "Frequency", y = "") +
    theme_bw() +
    theme(# margin: top, right, bottom, and left
      plot.margin = unit(c(1, 0.2, 0.2, -0.9), "cm"),
      panel.grid.minor = element_blank())
  #plot dendrogram
  plt_dendr <- ggplot(segment_data) +
    geom_segment(aes(x = x, y = y, xend = xend, yend = yend)) +
    scale_x_reverse(expand = c(0, 0.05)) +
    scale_y_continuous(breaks = sample_pos_table$y_center,
                       labels = sample_pos_table$sample,
                       limits = axis_limits,
                       expand = c(0, 0)) +
    labs(x = "Distance", y = "", colour = "", size = "") +
    theme_bw() +
    theme(panel.grid.minor = element_blank(),
          panel.grid.major = element_blank())
  #combine plots
  comb <- plot_grid(plt_dendr, plt_hbars, align = 'h', rel_widths = c(0.3, 1))
  return(comb)
}
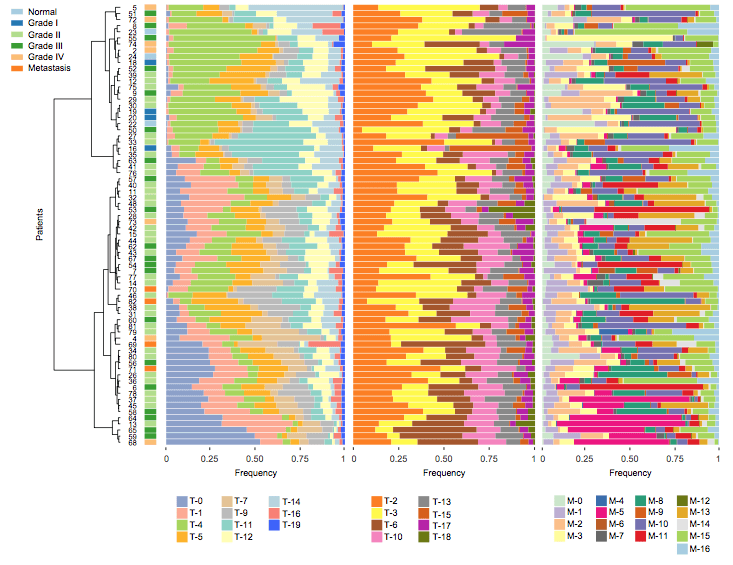
plot_dendro_bars_h(df = combined_matrix, dend = dendUPGMA, taxonomy = "example")
Данные могут быть объединены с любым деревом, которое может быть приведено к дендрограмме (например, также с деревьями UniFrac). Удачи тебе, Роман.

