Нахождение ближайших соседей радиальных отрезков
Во-первых, не пугайтесь внешности этого вопроса;)
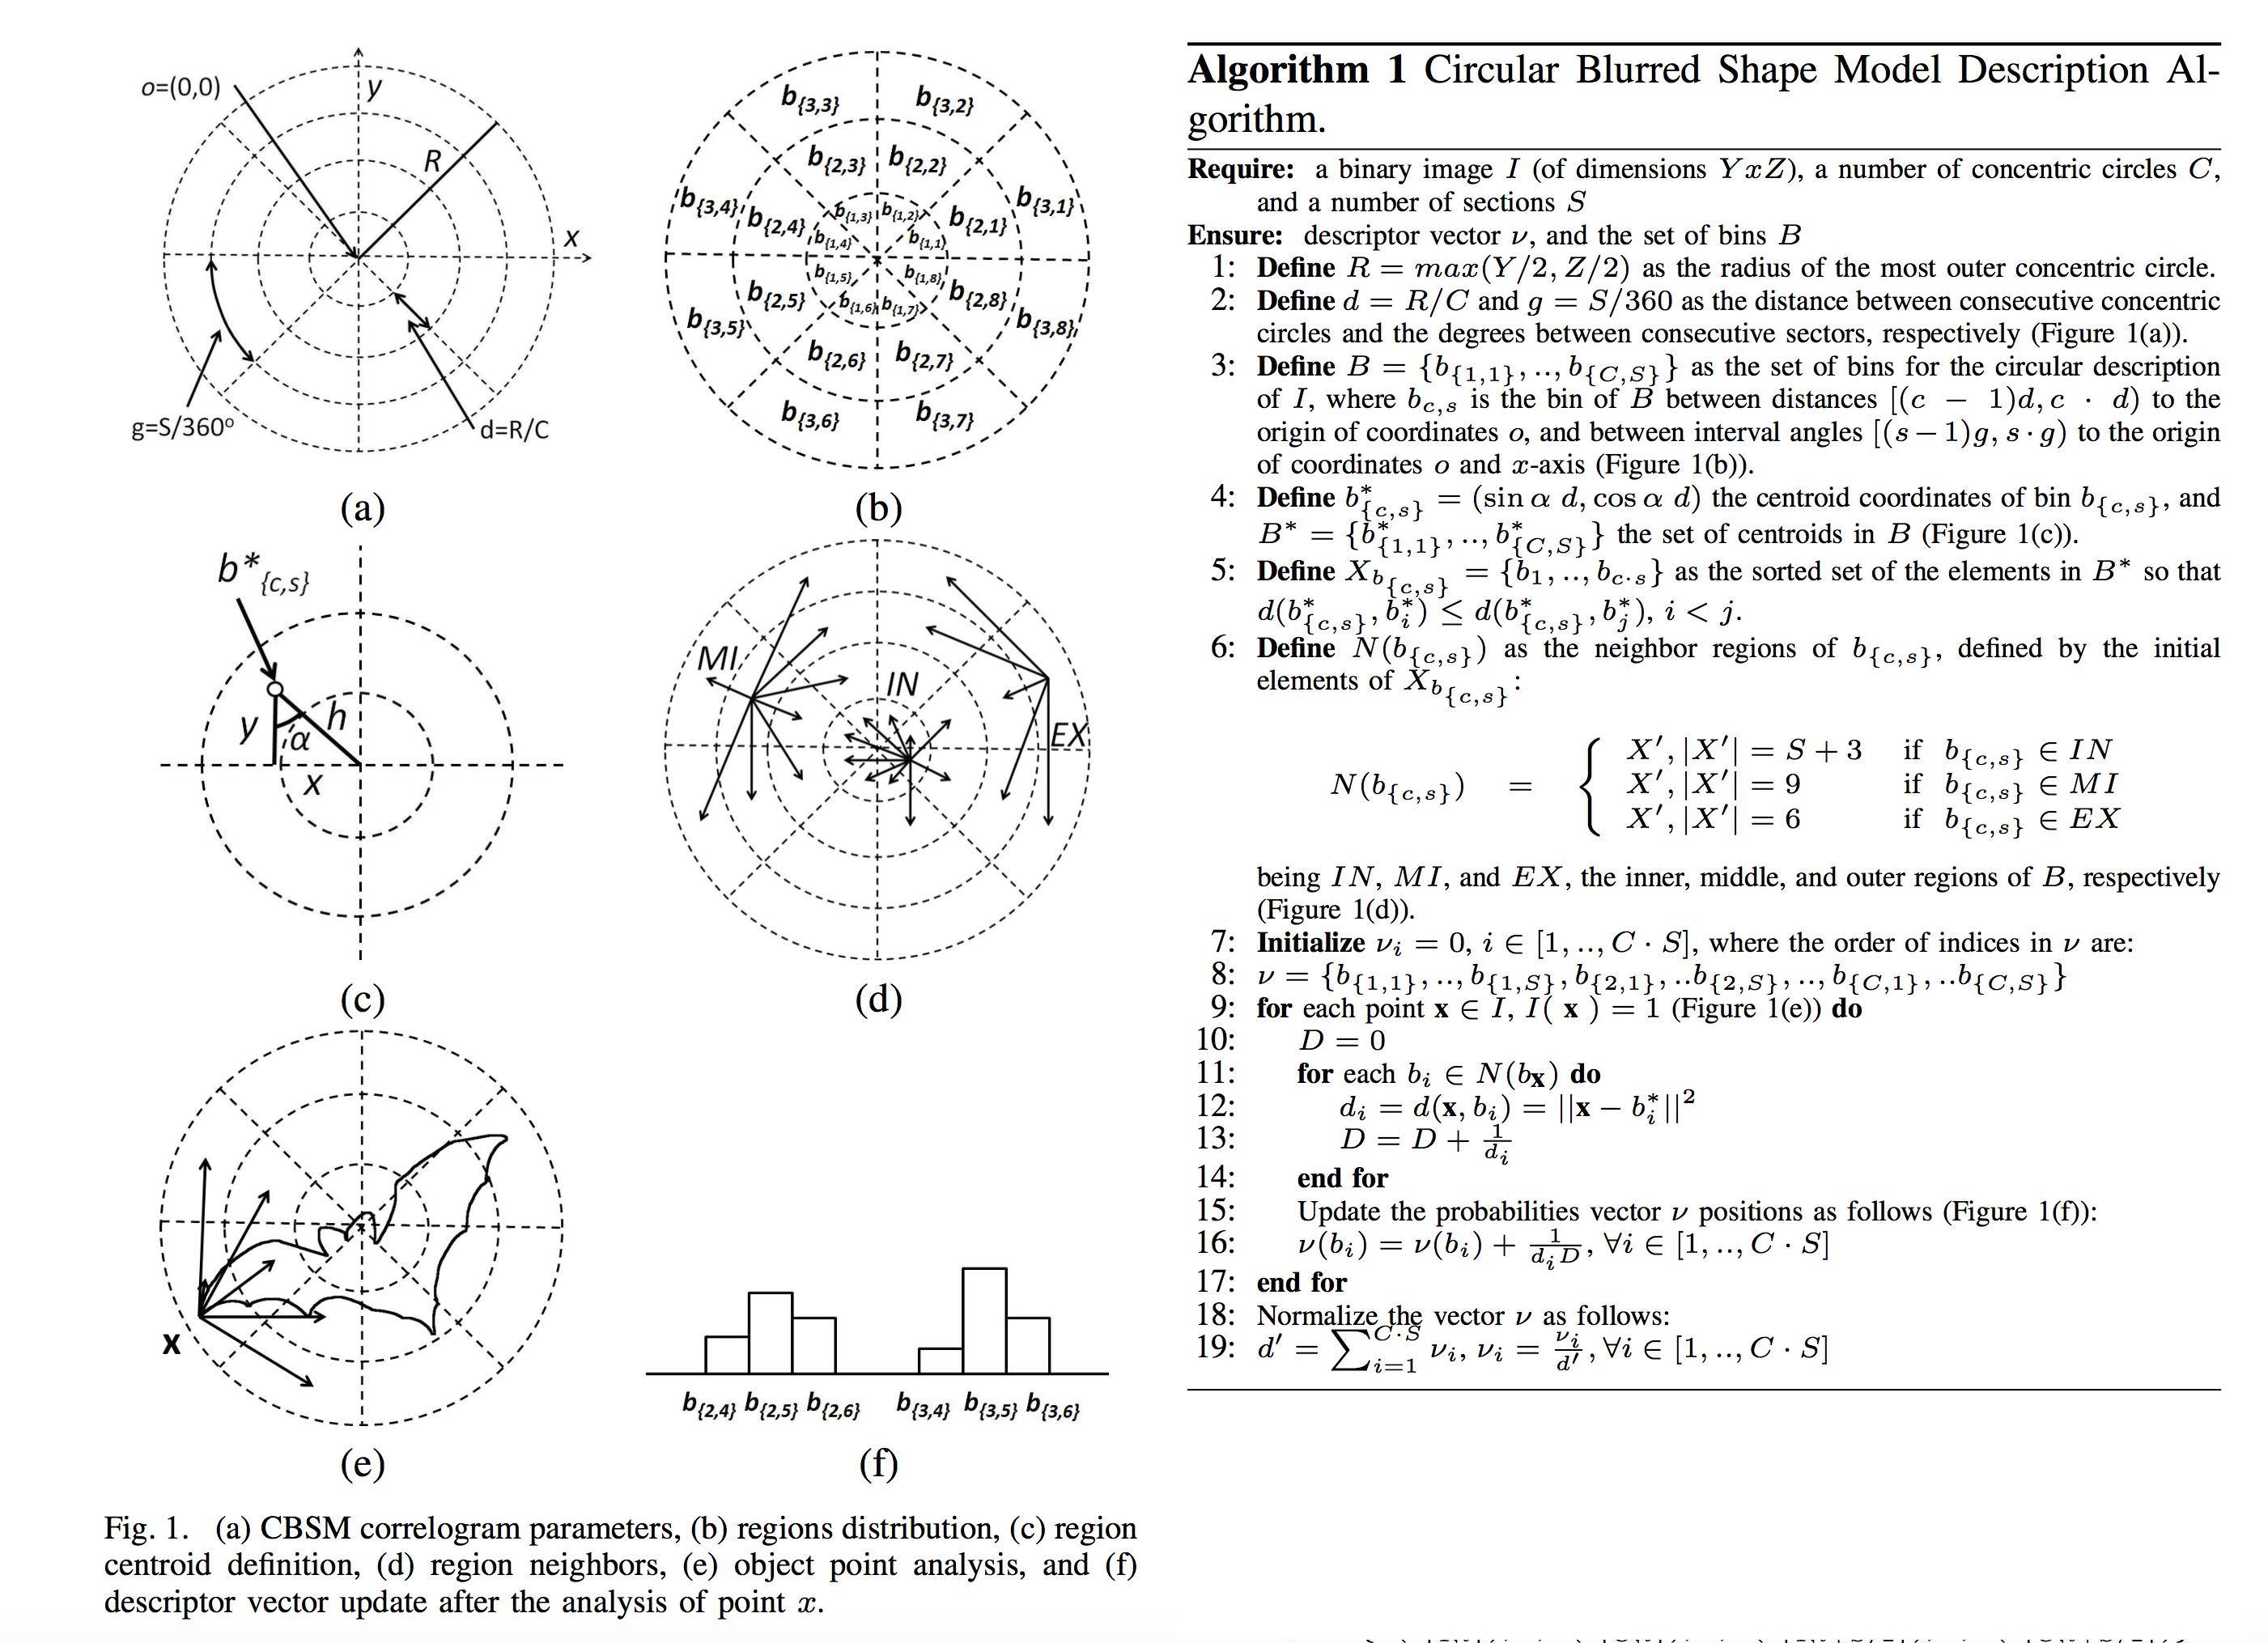
Я пытаюсь реализовать дескриптор формы в matlab под названием Circular Blurred Shape Model, и часть этого состоит в том, чтобы получить список ближайших соседей для каждого радиального сегмента, как можно видеть на рисунке 1d)
Я пошел на прямую и простую реализацию в MATLAB, но я застрял на шагах 5 и 6 алгоритма, главным образом потому, что не могу обернуть голову вокруг определения:
Xb{c,s} = {b1, ..., b{c*s}} as the sorted set of the elements in B*
so that d(b*{c,s}, bi*) <= d(b*{c,s}, bj*), i<j
Для меня это звучит как каскадная сортировка, сначала сортировка по возрастанию расстояния, а затем по возрастанию индекса, но ближайшие соседи, которых я нахожу, не соответствуют статье.
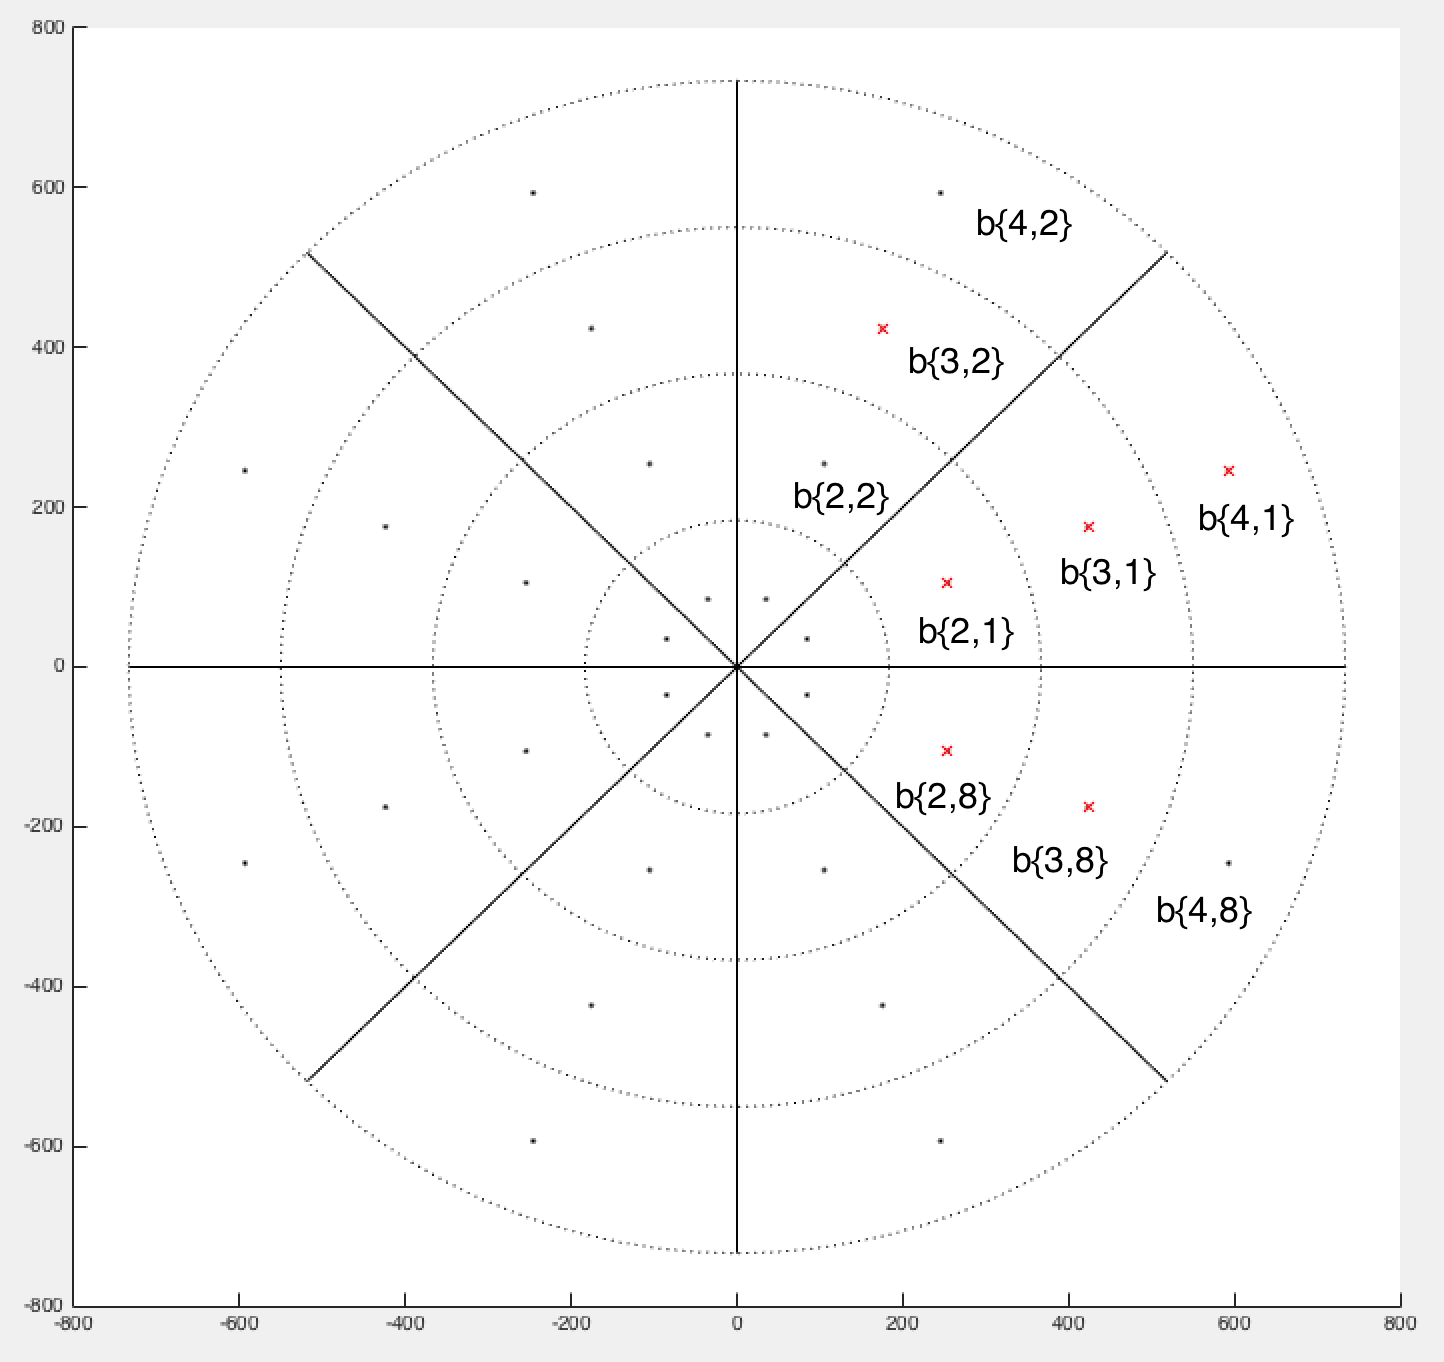
В качестве примера я показываю вам ближайших соседей, которых я получил для сегмента b{4,1}, это тот, который помечен "EX" на рисунке 1d)
Я получаю следующий список ближайших соседей для b{4,1}: b{3,2}, b{3,1}, b{3,8}, b{2,1}, b{2,8}
Правильно по статье будет: b{4,2}, b{4,8}, b{3,2}, b{3,1}, b{3,8}
Однако мои точки на самом деле ближе всего к выбранному сегменту, измеренному евклидовым расстоянием! Расстояние b{4,1} <=> b{2,1} меньше чем b{4,1} <=> b{4,2} или же b{4,1} <=> b{4,8}...
А вот мой (некрасивый, но прямой) код MATLAB:
width  = 734;
height = 734;

assert(width == height, 'Image must be square in size!');

% Radius of the correlogram
R = width;

% Number of circles in correlogram
C = 4;

% Number of sections in correlogram
S = 8;

% "width" of ring segments
d = R/C;

% angle of one segment in degrees
g = 360/S;

% set of bins for the circular description of I
B = zeros(C, S);

% centroid coordinates for bins
B_star = zeros(C,S,2);


% calculate centroids of bins
for c=1:C
    for s=1:S
        alpha = deg2rad(max(s-1, 0)*g + g/2);
        r     = d*max((c-1),0) + d/2;

        B_star(c,s,1) = r*cos(alpha);
        B_star(c,s,2) = r*sin(alpha);
    end
end

% create sorted list of bin numbers which fullfill
% d(b{c,s}*, bi*) <= d(b{c,s}, bj*) where i<j

% B_star_dists is a simple square distance matrix for getting
% the distance between two centroids c_i,s_i and c_j,s_j
B_star_dists = zeros(C*S, C*S);
for i=1:C*S
    [c_i, s_i] = ind2sub([C,S], i);
    % x,y centroid coordinates for point i
    b_star_i   = [B_star(c_i, s_i, 1), B_star(c_i, s_i, 2)];

    for j=1:C*S
        [c_j, s_j] = ind2sub([C,S], j);
        % x,y centroid coordinates for point j
        b_star_j   = [B_star(c_j, s_j, 1), B_star(c_j, s_j, 2)];

        % store the euclidean distance between these two centroids
        % in the distance matrix.
        B_star_dists(i,j) = norm(b_star_i - b_star_j);
    end
end

% calculate nearest neighbour "centroids" for each centroid
% B_NN is a cell array, B{idx} gives an array of indexes to the
% nearest neighbour centroids.

B_NN = cell(C*S, 1);
for i=1:C*S
    [c_i, s_i] = ind2sub([C,S], i);

    % get a (C*S)x2 matrix of all distances, the first column are the array
    % indexes and the second column are the distances e.g
    % 1   d1
    % 2   d2
    % ..  ..
    % CS  d{c,s}

    dists = [transpose(1:C*S), B_star_dists(:, i)];

    % sort ascending by the distances first (e.g second column) then
    % sort ascending by the array index (e.g first column)
    dists = sortrows(dists, [2,1]);

    % middle section has nine neighbours, set as default
    neighbour_count = 9;

    if c_i == 1
        % inner region has S+3 neighbours
        neighbour_count = S+3;
    elseif c_i == C
        % outer most ring has 6 neighbours
        neighbour_count = 6;
    end

    B_NN{i} = dists(1:neighbour_count,1);
end

% FROM HERE ON JUST VISUALIZATION CODE

figure(1);
hold on;
for c=1:C
    % plot circles
    r = c*d;
    plot(r*cos(0:pi/50:2*pi), r*sin(0:pi/50:2*pi), 'k:');
end

for s=1:S
    % plot lines

    line_len = C*d;
    alpha    = deg2rad(s*g);

    start_pt = [0, 0];
    end_pt   = start_pt + line_len.*[cos(alpha), sin(alpha)];

    plot([start_pt(1), end_pt(1)], [start_pt(2), end_pt(2)], 'k-');
end

for c=1:C
    % plot centroids of segments
    for s=1:S
        segment_centroid = B_star(c,s, :);
        plot(segment_centroid(1), segment_centroid(2), '.k');
    end
end

% plot some nearest neighbours
% list of [C;S]
plot_nn = [4;1];

for i = 1:size(plot_nn,2)
   start_c = plot_nn(1,i);
   start_s = plot_nn(2,i);

   start_pt = [B_star(start_c, start_s,1), B_star(start_c, start_s,2)];
   start_idx = sub2ind([C, S], start_c, start_s);

   plot(start_pt(1), start_pt(2), 'xb');

   nn_idx_list = B_NN{start_idx};

   for j = 1:length(nn_idx_list)
      nn_idx = nn_idx_list(j);
      [nn_c, nn_s] = ind2sub([C, S], nn_idx);
      nn_pt = [B_star(nn_c, nn_s,1), B_star(nn_c, nn_s,2)];

      plot(nn_pt(1), nn_pt(2), 'xr');
   end
end
Полный текст статьи можно найти здесь.
3 ответа
Газета говорит о "соседях по региону"; Интерпретация того, что это "ближайшие соседи" в евклидовом смысле расстояния, неверна. Это просто регионы, которые являются соседями определенного региона, и способ их нахождения тривиален:
Регионы имеют 2 координаты: (c,s) где c обозначает концентрическую окружность, частью которой они являются, от 1 в центре до C на краю, а s обозначает сектор, в который они входят, от 1, начиная с угла От 0° до S, заканчивающийся под углом 360°.
Каждый регион, чьи координаты c и s отличаются не более чем на 1 от координат региона, является соседним регионом (номера сегментов переносятся от S до 1.) В зависимости от местоположения региона существует 3 случая: (как показано на рис. 1д)
Регион является средним регионом (обозначен MI), например, регион b(2,4)
Есть 2 соседних круга и 2 соседних сектора, так что всего 9 областей:
каждая область в кругу 1, 2 или 3 и секторе 3, 4 или 5:b(1,3), b(2,3), b(3,3), b(1,4), b(2,4), b(3,4), b(1,5), b(2,5), b(3,5)Область является внутренней областью (отмечена IN), например, область b(1,8)
Существует только один соседний круг и 2 соседних сектора, но все внутренние области являются соседями, поэтому всего S + 3 областей:
каждая область в кругу 2 и секторе 7, 8 или 1:b(2,7), b(2,8), b(2,1)
и каждый регион во внутреннем круге:b(1,1), b(1,2), b(1,3), b(1,4), b(1,5), b(1,6), b(1,7), b(1,8)Регион является внешним регионом (обозначен EX), например, регион b(3,1)
Существует только один соседний круг и 2 соседних сектора, поэтому всего 6 областей:
каждая область в кругу 2 или 3 и секторе 8, 1 или 2:b(2,8), b(2,1), b(2,2), b(3,8), b(3,1), b(3,2)
Чтобы добавить немного matlab к великолепному ответу @m69, вы можете автоматизировать индексацию соседей следующим образом:
%assume C and S defined according to the answer of @m69
iif=@(varargin) varargin{2*find([varargin{1:2:end}], 1, 'first')}();
ncfun=@(c) iif(c==1,c+1,c==C,c-1,true,[c-1, c+1]);
nsfun=@(s)mod([s-1, s+1]-1,S)+1;
neighbs=@(c,s) [b(c,nsfun(s)), b(ncfun(c),s)', reshape(b(ncfun(c),nsfun(s)),1,[])];
Первый определяет inline, если для использования в анонимных функциях, чтобы избавить от необходимости определять функции в отдельных файлах (это было бы необходимо для
cдело). Это имеет синтаксисiif(condition1,result1,condition2,result2,...)где каждое условие проверяется одно за другим, и результат, соответствующий первому условию, даетtrueвозвращаетсяВторой определяет радиальные индексы соседей с помощью if: return [c-1, c+1], если ни один из них не определен (что приведет к нарушениям границ массива)
Третий определяет периодическую индексацию для угловых секторов, так что для
S=4nsfun(2)==[1, 3]а такжеnsfun(4)==[3, 1],Я просто добавил пример, где для данной действительной пары
c,sneighbs(c,s)вернет подмассивb(1:C,1:S)которые являются соседями: сначала соседи вверх-вниз / влево-вправо, затем (до) четырех угловых.
Потратив слишком много часов на это, я понял, что трюк для вычисления соседних областей элемента b{c,s} был:
Возьмем все отрезки для соседних колец c, включая сам c, т.е.
c-1, c, c+1, если это самый внутренний круг, то толькоc,c+1если это самый внешний принятьc-1, cРассчитайте евклидово расстояние от b{c,s} до всех выбранных центроидов из предыдущего шага, включая саму точку b{c,s}
Отсортируйте расстояния в порядке возрастания и возьмите первые N сегментов.
Дескриптор работает довольно хорошо, однако его вращательная инвариантность зависит от оси с самой высокой плотностью, в некоторых случаях это очень чувствительно к шуму / окклюзии, то есть дескриптор может быть выключен на +/- 1.
Вот полная реализация дескриптора CBSM в MATLAB, никак не оптимизированная (я слышал, что MATLAB ненавидит циклы for):
csbm.m
function [descriptor] = csbm(I, R, C, S)
    % Input:
    % ------
    % I = The image, binary, must be square in sice
    % R = The radius of the correlogram, could be half the image width
    % C = Number of circles
    % S = Number of segments per circle

    % Output:
    % -------
    % A C*S-by-1 row vector, the descriptor

    [width, height] = size(I);
    assert(width == height, 'Image must be square in size!');

    % "width" of ring segments
    d = R/C;

    % angle of one segment in degrees
    g = 2*pi/S;

    % centroid coordinates for bins
    B_star = zeros(C*S,2);

    % initialize the descriptor
    descriptor = zeros(C*S,1);

    % calculate centroids of bins
    for c=1:C
        for s=1:S
            alpha = max(s-1, 0)*g + g/2;
            r     = d*max((c-1),0) + d/2;
            ind   = (c-1)*S+s; %sub2ind(cs_size, c,s);

            B_star(ind, :) = [r*cos(alpha), r*sin(alpha)];
        end
    end

    % calculate nearest neighbor regions
    B_NN = cell(C*S,1);

    for c=1:C
        min_circle = max(1,c-1);
        max_circle = min(C,c+1);

        start_sel  = (min_circle-1)*S+1;
        end_sel    = (max_circle)*S;

        centroids  = B_star(start_sel:end_sel, :);

        for s=1:S
            current_ind   = (c-1)*S+s;
            centroid      = B_star(current_ind, :);
            num_centroids = length(centroids);
            distances     = sqrt(sum((centroids-repmat(centroid, num_centroids,1)).^2,2));

            distances     = horzcat(distances, transpose((start_sel:end_sel)));
            distances     = sortrows(distances, [1,2]);

            neighbour_count = 9;

            if c == 1
                % inner region has S+3 neighbours
                neighbour_count = S+3;
            elseif c == C
                % outer most ring has 6 neighbours
                neighbour_count = 6;
            end


            B_NN{current_ind} = distances(1:neighbour_count, 2);
        end
    end

    for x=1:width
        x_centered = x-width/2;

        for y=1:width
            if I(x,y) == 0
                continue;
            end

            y_centered = y-width/2;

            % bin the image point
            r = sqrt(x_centered^2 + y_centered^2);
            a = wrapTo2Pi(atan2(y_centered, x_centered));

            % get bin
            c_pixel = max(1, floor(r/d));
            s_pixel = max(1, floor(a/g));

            if c_pixel > C
                continue;
            end

            ind_pixel = (c_pixel-1)*S+s_pixel;
            pt_pixel  = [x_centered, y_centered];

            % get neighbours of this bin
            neighbours = B_NN{ind_pixel};

            % calculate distance to neighbours
            nn_dists   = sqrt(sum((B_star(neighbours, :) - repmat(pt_pixel, length(neighbours), 1)).^2,2));

            D = sum(1./nn_dists);

            % update the probabilities vector
            descriptor(neighbours) = descriptor(neighbours) + 1./(nn_dists.*D);
        end
    end

    % normalize the vector v
    descriptor   = descriptor./sum(descriptor);

    % make it rotationally invariant
    G = zeros(S/2, 2*C);

    for s=1:S/2
        for c=1:C
            G(s,c)   = descriptor((c-1)*S+s);
            G(s,c+C) = descriptor((c-1)*S+s+S/2);
        end
    end

    [~, max_G_idx] = max(sum(G,2));

    L_G = 0;
    R_G = 0;

    for j=1:C
        for k=1:S
            if k > (max_G_idx) && k < (max_G_idx+S/2)
                L_G = L_G + descriptor((j-1)*S+k);
            elseif k ~= max_G_idx && k ~= (max_G_idx+S/2)
                R_G = R_G + descriptor((j-1)*S+k);
            end
        end
    end

    if L_G > R_G
        % B is rotated k=i+S/2-1 positions to the left:
        fprintf('rotate %d to the left\n', max_G_idx+S/2-1);
        rotate_by = -(max_G_idx+S/2-1);
    else
        % B is rotated k=i-1 positions to the right:
        fprintf('rotate %d to the right\n', max_G_idx-1);
        rotate_by = -(max_G_idx-1);
    end

    % segments are grouped by circle
    % so for every circle we get all segments and circular shift them
    for c=1:C
       range_sel = ((c-1)*S+1):(c*S);
       segments  = descriptor(range_sel);
       descriptor(range_sel) = circshift(segments, [rotate_by,0]);
    end
end
plot_descriptor.m
function plot_descriptor(R,C,S, descriptor)
    % Input:
    % ------
    % R Radius for the correlogram in pixels, can be arbitrary
    % C Number of circles
    % S Number of segments per circle
    % descriptor The C*S-by-1 descriptor vector


    % "width" of ring segments
    d = R/C;

    % angle of one segment in degrees
    g = 2*pi/S;

    % full image
    [x,y] = meshgrid(-R:R);
    [theta, rho] = cart2pol(x,y);
    theta = wrapTo2Pi(theta);
    brightness   = zeros(size(rho));

    min_val     = min(descriptor);
    max_val     = max(descriptor);
    scale_fact  = 1/(max_val-min_val);

    for c=1:C
        rInner = (c-1)*d;
        rOuter = c*d;

        for s=1:S
            idx = (c-1)*S+s;

            minTheta = (s-1)*g;
            maxTheta = (s*g);

            matching_theta = find(theta > minTheta & theta < maxTheta);
            matching_rho   = find(rho > rInner & rho < rOuter);
            matching_idx   = intersect(matching_theta, matching_rho);

            intensity = descriptor(idx)*scale_fact;

            brightness(matching_idx) = intensity;
        end
    end

    figure; imshow(mat2gray(brightness));
Как запустить:
I = imread('bat-18.gif');
I = transpose(im2bw(I, graythresh(I)));
I = edge(I);

[width, height] = size(I);
R = width/2;
C = 24;
S = 24;

descriptor = csbm(I, R, C, S);
plot_descriptor(R,C,S,descriptor);
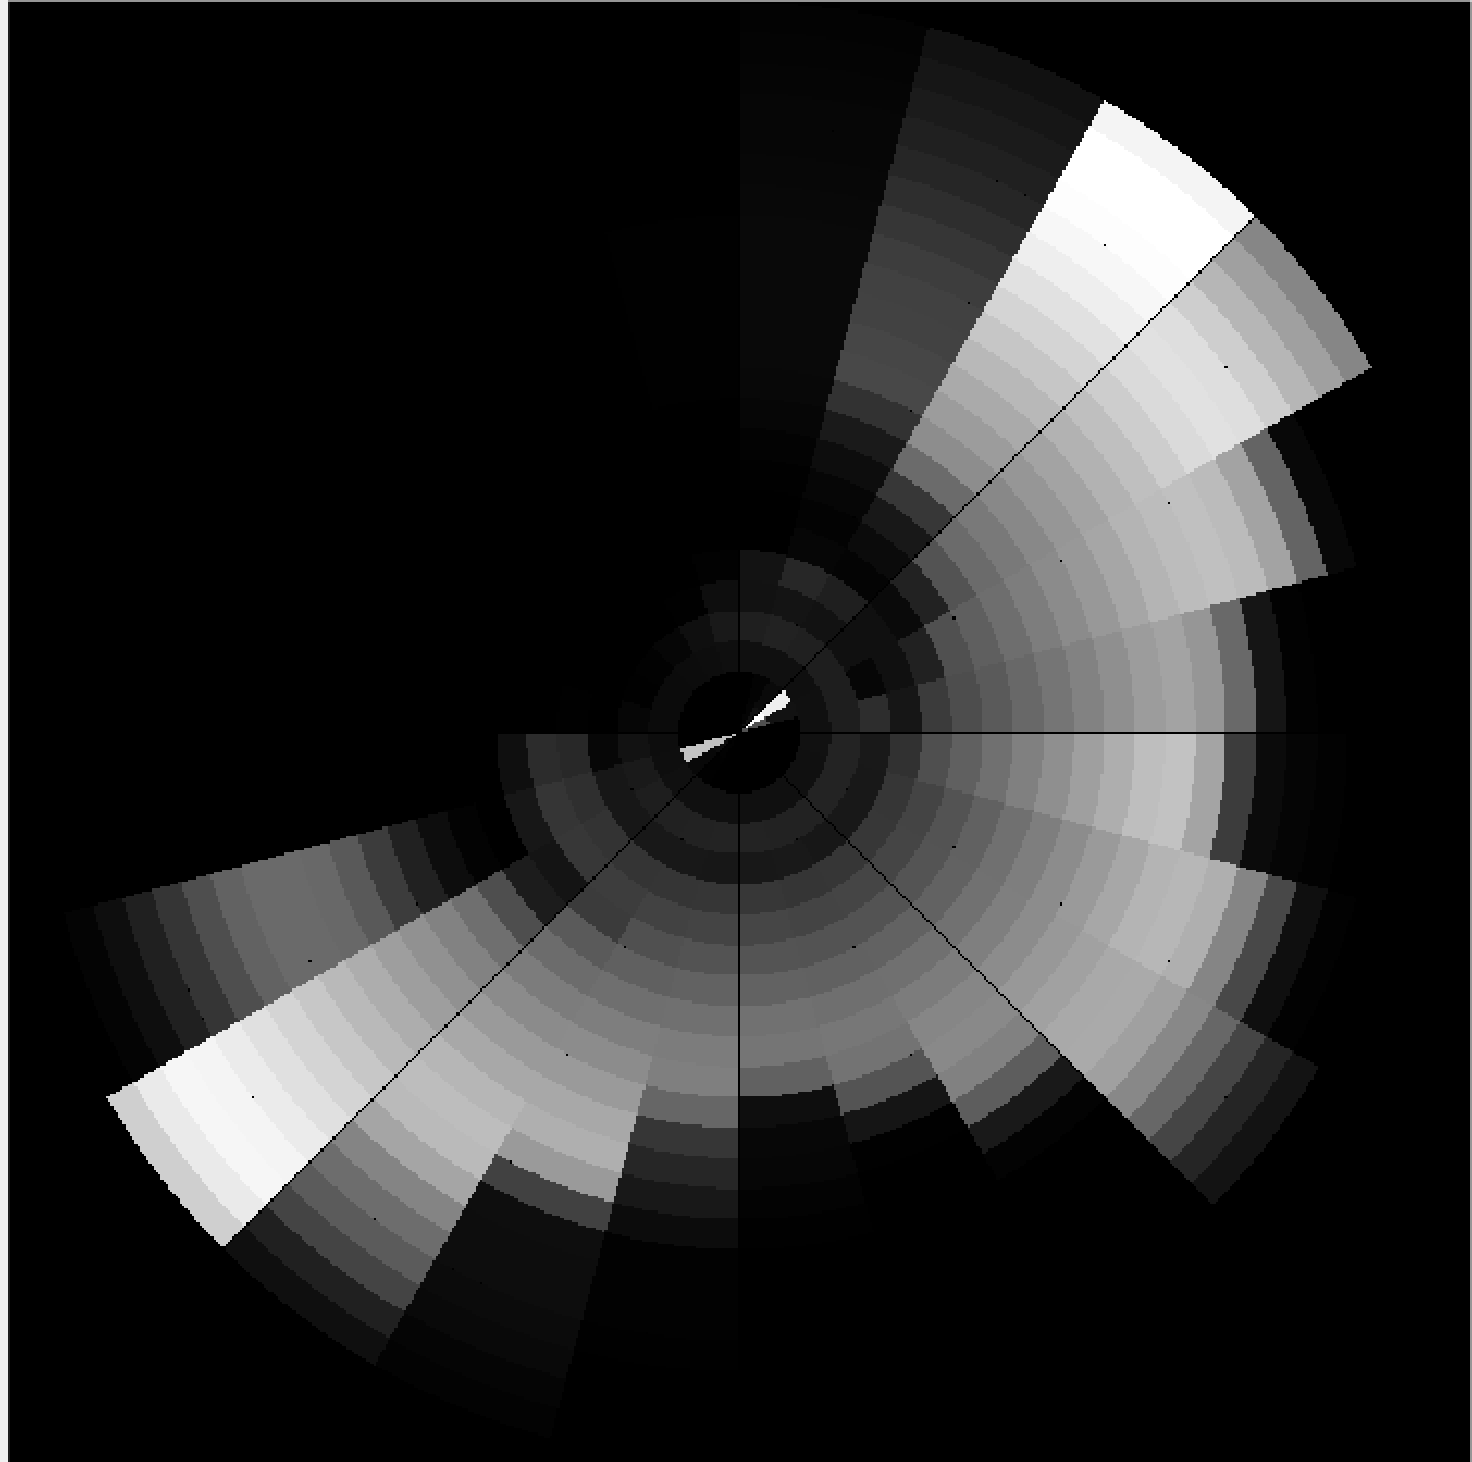
Выход:
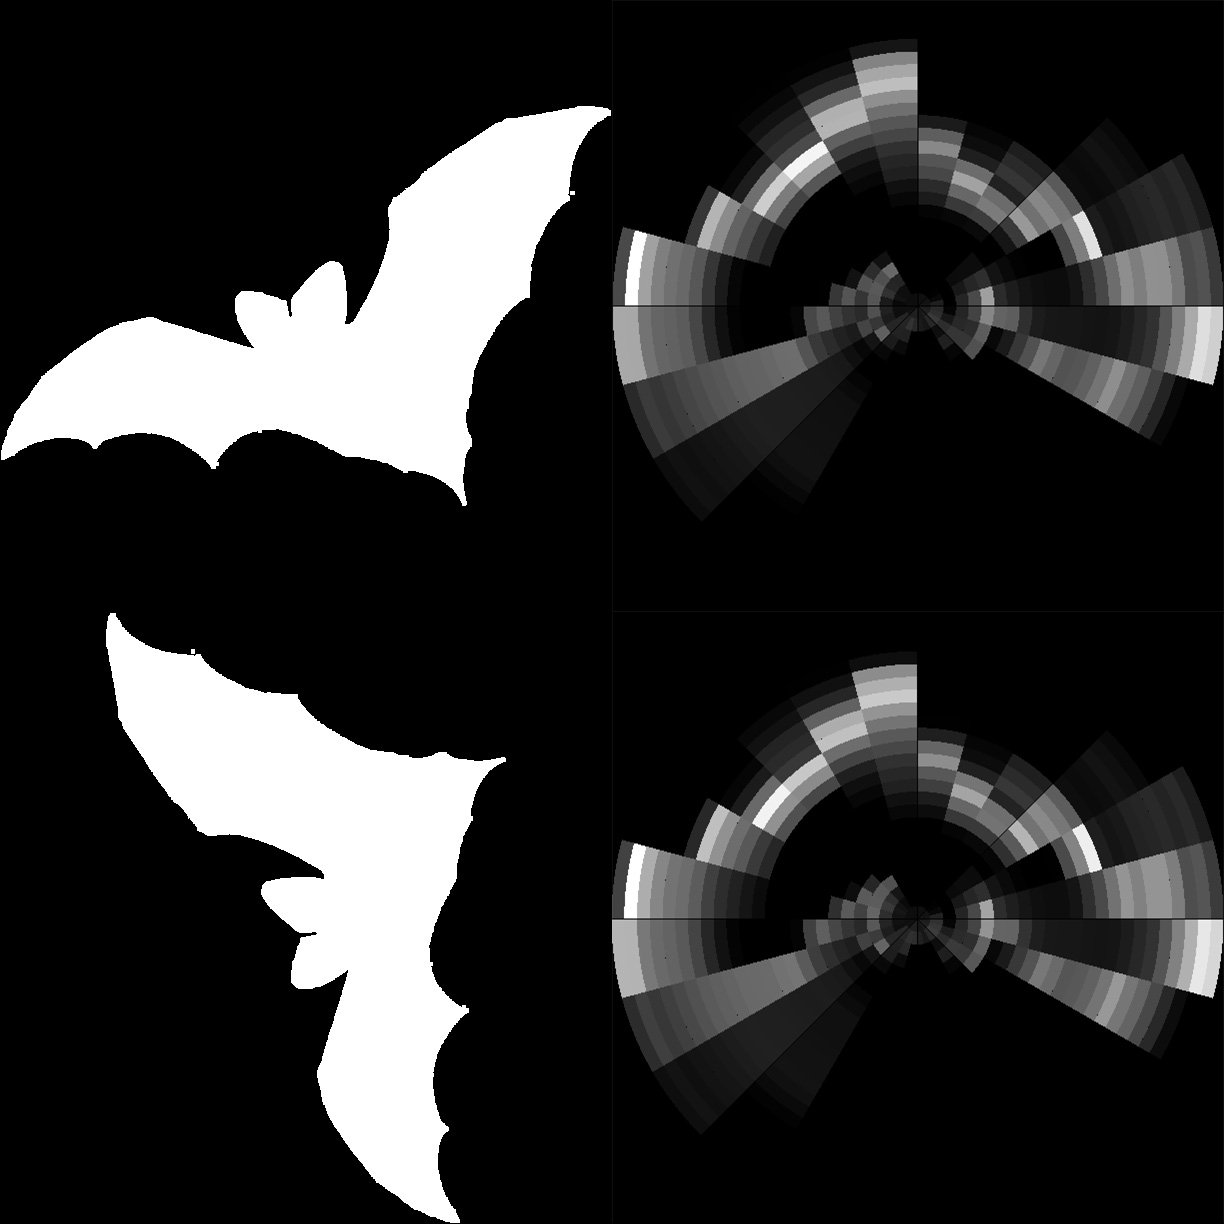
Просто ради пиков, некоторые страшные картинки происходили при кодировании:


