Как расположить 2 строки, а затем 1 столбец с renderPlot в rmarkdown html_notebook с блестящей средой выполнения
Рассмотрим следующий пример rmarkdown html_notebook:
---
output: html_notebook
runtime: shiny
---

```{r}
library(ggplot2)
library(shiny)

blank1 <- renderPlot({ ggplot() + labs(title = "Plot 1") })
blank2 <- renderPlot({ ggplot() + labs(title = "Plot 2") })
blank3 <- renderPlot({ ggplot() + labs(title = "Plot 3") })

column(6, blank1, blank2)
column(6, blank3)
```
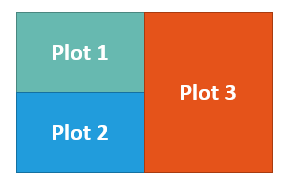
Я хотел бы, чтобы графики отображались как:
Я пробовал несколько вещей, в том числе:
fluidRow(
  column(6, blank1, blank2),
  column(6, blank3)
)
Но я не смог получить Plot 3 чтобы охватить несколько строк.
Дополнительные примечания (за комментарии):
- Я бы приветствовал
cowplotили жеpatchworkрешение, но мне нужна реактивность отshiny(напримерggplot(aes(x = input$var_select)) + ..., - В идеале я хотел бы использовать
column()и / илиfluidRow()сохранить аспекты адаптивного дизайна.
1 ответ
Я смог решить эту проблему, передав высот в renderPlot в явном виде. Я все еще очень заинтересован в других решениях:
blank1 <- renderPlot({ ggplot() + labs(title = "Plot 1") }, height = 200)
blank2 <- renderPlot({ ggplot() + labs(title = "Plot 2") }, height = 200)
blank3 <- renderPlot({ ggplot() + labs(title = "Plot 3") }, height = 400)

fluidRow(
  column(6, fluidRow(blank1), fluidRow(blank2)),
  column(6, fluidRow(blank3))
)
Это не идеально из-за адаптивного подхода к дизайну, но это будет работать.
htt ps://stackru.com/images/8650dcd607ea3de8937ab0c46c310b31beeae3e9.gif
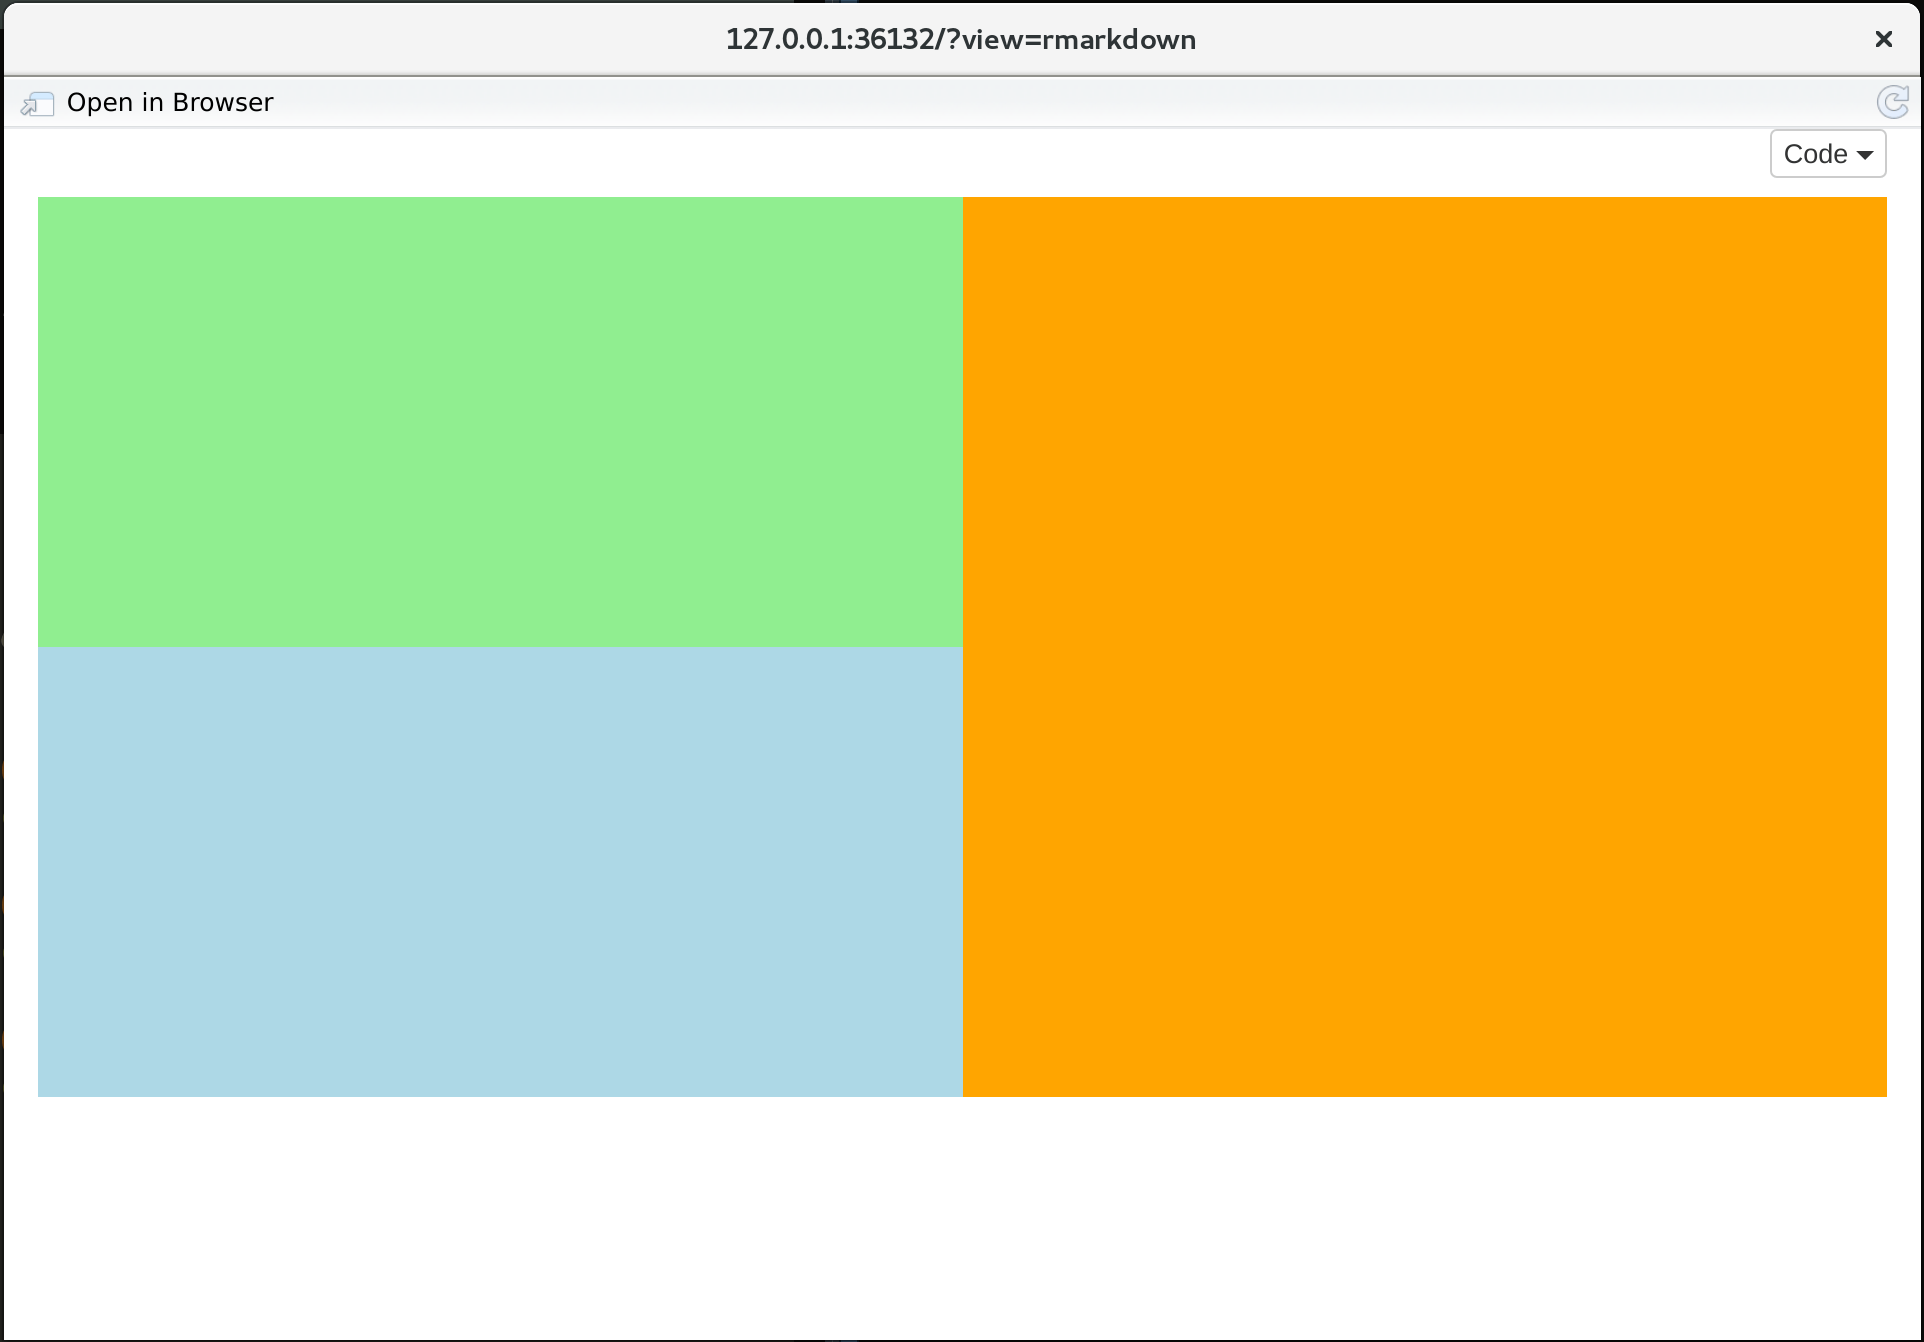
Вы можете попробовать что-то вроде следующего, в котором поля на графике и столбцах устанавливаются равными 0, а высота участка 3 в два раза больше, чем на графиках 1 и 2.
---
output: html_notebook
runtime: shiny
---

<!-- break between code folding button and fluid layout -->
<br>

```{r echo=FALSE, message=FALSE}
library(ggplot2)
library(shiny)

# create the plots telling ggplot to use 0 margins

p1 <- ggplot() +
      theme(plot.margin = unit(c(0,0,0,0), "cm"),
            panel.background=element_rect(fill = "lightgreen"))
p2 <- ggplot() +
      theme(plot.margin = unit(c(0,0,0,0), "cm"),
            panel.background=element_rect(fill = "lightblue"))
p3 <- ggplot() +
      theme(plot.margin = unit(c(0,0,0,0), "cm"),
            panel.background=element_rect(fill = "orange"))

# Set the heights in renderPlot so that plot 3 is twice the height
# of the other 2 plots

blank1 <- renderPlot({p1}, height=200)
blank2 <- renderPlot({p2}, height=200)
blank3 <- renderPlot({p3}, height=400)

# Tell the fluid layout to set padding and margin to 0 for the column divs

fluidPage(
  fluidRow(
    column(6, blank1, blank2, offset=0, style='padding:0px;margin:0px;'),
    column(6, blank3, offset=0, style='padding:0px;margin:0px;')
  )
)
```
В результате получается следующее:

