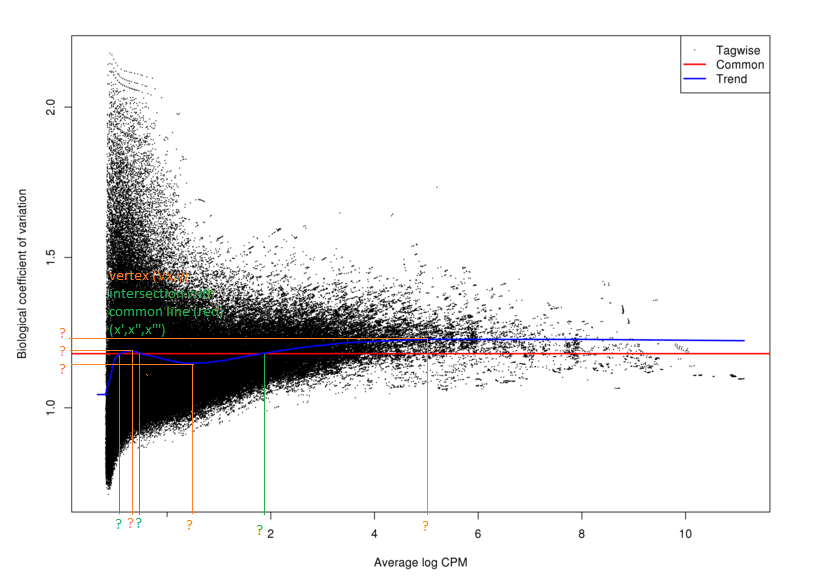
Нахождение координат из графика BCV в edgeR
Как мне узнать функцию (x) и, следовательно, координаты функции, которая генерирует график дисперсии (BCV) из пакета edgeR?
Мне нужно знать "координаты" вершины (максимальное и минимальное значение для каждой вершины)"дисперсионного тренда" и где "линия тренда (синяя)" пересекается с общей дисперсионной линией (красная линия)
Для удобства я сделал пример:
data <- "chr start end depth depth1 depth2 depth3 depth4 depth5 depth6
chr1 3273 3273 7 200 35 1 200 850 0
chr1 3274 3274 3 50 25 5 300 1500 2
chr1 3275 3275 8 600 15 8 100 300 5
chr1 3276 3276 4 30 2 10 59 20 0
chr1 3277 3277 25 20 7 4 600 45 0"
data <- read.table(text=data, header=T)

datamatrix <- data [, c(4:10)]
library (edgeR)

#grouping factor
group <- c(1, 2, 2, 2, 2, 2, 2) #groups of each sample)

#create a DGEList
y <- DGEList(counts=datamatrix,group=group)
В соответствии с пакетом edgeR, я могу оценить дисперсию моего набора данных, используя:
y <- estimateDisp(y)

y$common.dispersion
Квадратный корень общей дисперсии дает коэффициент биологической изменчивости. И оценки дисперсии можно посмотреть на графике BCV:
plotBCV(y)
1 ответ
Решение
Я думаю, что это решает трюк
#finding dispersion coordinates

    afun <- approxfun(y$AveLogCPM, y$trended.dispersion)

#ranging between -2 and 12 the "par" number to check the intersection
    optim(par=-1, function(x) { (afun(x) - y$common.dispersion)^2 }) #-0.9056
    optim(par=0, function(x) { (afun(x) - y$common.dispersion)^2 }) #-0.4955
    optim(par=2, function(x) { (afun(x) - y$common.dispersion)^2 }) #1.8237

#with the plotBCV function code, I have the access to tagwise, trended, common dispersions, and the abundance values, for each CpG as: y$tagwise.dispersion, y$trended.dispersion, y$common.dispersion, and y$AveLogCPM, respectively.

min (y$trended.dispersion) #[1] 1.09009
max (y$trended.dispersion) #[1] 1.50691

#to the vertex, you can subset a table according to the AveLogCPM range that you want to know the max and min like this:

afuntable<- data.table(y$AveLogCPM, y$trended.dispersion)
afuntablemod <-subset (afuntable, V1 >= 0)
afuntablemod <-subset (afuntablemod, V1 <= 2)
min (afuntablemod$V2) #[1] 1.318002

#and again
afuntable<- data.table(y$AveLogCPM, y$trended.dispersion)
afuntablemod <-subset (afuntable, V1 >= 2)
afuntablemod <-subset (afuntablemod, V1 <= 12)
max (afuntablemod$V2) #[1] 1.50691
