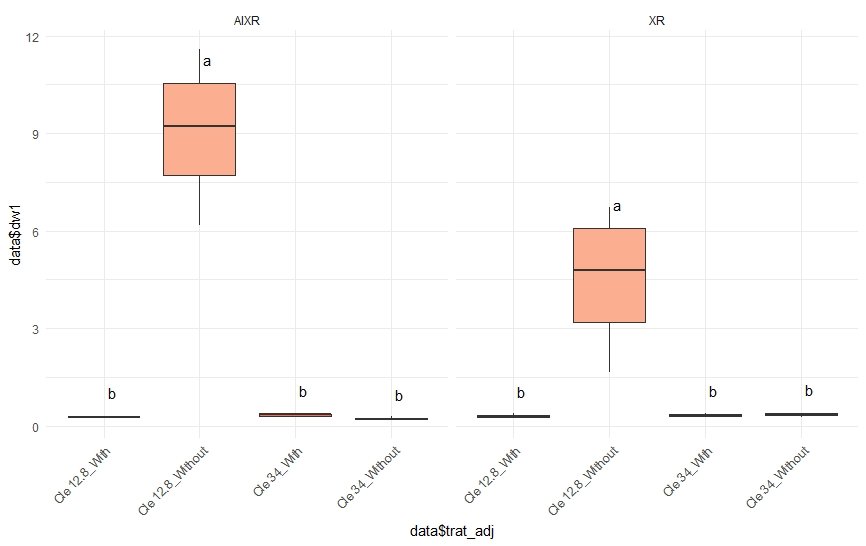
Двусторонний тест ANOVA Тьюки и коробчатая диаграмма в R
Я следую этому руководству и этому вопросу 1, вопросу 2, чтобы построить график двустороннего ящика с фасетами и буквами, обозначающими статическую разницу между обработками. Кто-нибудь знает, как сделать такой график?
Немного кода о моих попытках:
    library(multcompView)
    library(ggplot2)
    #sample dataframe
    data <- structure(list(nozzle = c("XR", "XR", "XR", "XR", "XR", "XR", "XR", "XR",
                                      "XR", "XR", "XR", "XR", "XR", "XR", "XR", "XR",
                                      "AIXR", "AIXR", "AIXR", "AIXR", "AIXR", "AIXR",
                                      "AIXR", "AIXR", "AIXR", "AIXR", "AIXR", "AIXR",
                                      "AIXR", "AIXR", "AIXR", "AIXR"),
                           trat = c("Cle 12.8", "Cle 12.8", "Cle 12.8", "Cle 12.8",
                                    "Cle 34", "Cle 34", "Cle 34", "Cle 34", "Cle 12.8",
                                    "Cle 12.8", "Cle 12.8", "Cle 12.8", "Cle 34", "Cle 34",
                                    "Cle 34", "Cle 34", "Cle 12.8", "Cle 12.8", "Cle 12.8",
                                    "Cle 12.8", "Cle 34", "Cle 34", "Cle 34", "Cle 34",
                                    "Cle 12.8", "Cle 12.8", "Cle 12.8", "Cle 12.8", "Cle 34",
                                    "Cle 34", "Cle 34", "Cle 34"),
                           adj = c("Without", "Without", "Without", "Without", "Without",
                                   "Without", "Without", "Without", "With", "With", "With",
                                   "With", "With", "With", "With", "With", "Without", "Without",
                                   "Without", "Without", "Without", "Without", "Without", "Without",
                                   "With", "With", "With", "With", "With", "With", "With", "With"),
                           dw1 = c(3.71, 5.87, 6.74, 1.65, 0.27, 0.4, 0.37, 0.34, 0.24, 0.28, 0.32,
                                   0.38, 0.39, 0.36, 0.32, 0.28, 8.24, 10.18, 11.59, 6.18, 0.2, 0.23,
                                   0.2, 0.31, 0.28, 0.25, 0.36, 0.27, 0.36, 0.37, 0.34, 0.19)), row.names = c(NA, -32L), class = c("tbl_df", "tbl", "data.frame"))

    #function
    generate_label_df <- function(TUKEY, variable){

      # Extract labels and factor levels from Tukey post-hoc
      Tukey.levels <- variable[,4]
      Tukey.labels <- data.frame(multcompLetters(Tukey.levels)['Letters'])

      #I need to put the labels in the same order as in the boxplot :
      Tukey.labels$treatment=rownames(Tukey.labels)
      Tukey.labels=Tukey.labels[order(Tukey.labels$treatment) , ]
      return(Tukey.labels)
    }

    # What is the effect of the treatment on the value ?
model=lm( data$dw1~ data$trat:data$adj )
ANOVA=aov(model)

# Tukey test to study each pair of treatment :
TUKEY <- TukeyHSD(x=ANOVA, 'data$trat', conf.level=0.95)

# Tuckey test representation :
plot(TUKEY , las=1 , col="brown")

p <- ggplot(data=data, aes(x=trat , y=dw1, fill=adj)) +
      geom_boxplot(outlier.shape=NA) +
      facet_grid(~nozzle) +
      scale_fill_brewer(palette="Reds") +
      theme_minimal() +
      theme(legend.position="none") +
      theme(axis.text.x=element_text(angle=45, hjust=1))

    for (facetk in as.character(unique(data$nozzle))) {
      subdf <- subset(data, as.array(nozzle==facetk))
      model=lm(dw1 ~ trat:adj, data=subdf)
      ANOVA=aov(model)
      TUKEY <- TukeyHSD(ANOVA)

      labels <- generate_label_df(TUKEY , TUKEY$`trat:adj`)
      names(labels) <- c('Letters','trat')
      yvalue <- aggregate(.~nozzle, data=subdf, quantile, probs=0.75)
      final <- merge(labels, yvalue)
      final$nozzle <-  facetk

      p <- p + geom_text(data = final,  aes(x=trat, y=value_y, label=Letters),
                         vjust=-1.5, hjust=-.5)
    }
    p
Я получаю эту ошибку
Ошибка в quantile.default(X[[i]], ...): множители не допускаются
Я знаю, что мне нужно вводить числа, а не коэффициенты в квантиль, но я не знаю, исправлю ли я эту ошибку, буквы на моем графике появятся.
1 ответ
Решение
data <- structure(list(nozzle = c("XR", "XR", "XR", "XR", "XR", "XR", "XR", "XR",
                                  "XR", "XR", "XR", "XR", "XR", "XR", "XR", "XR",
                                  "AIXR", "AIXR", "AIXR", "AIXR", "AIXR", "AIXR",
                                  "AIXR", "AIXR", "AIXR", "AIXR", "AIXR", "AIXR",
                                  "AIXR", "AIXR", "AIXR", "AIXR"),
                       trat = c("Cle 12.8", "Cle 12.8", "Cle 12.8", "Cle 12.8",
                                "Cle 34", "Cle 34", "Cle 34", "Cle 34", "Cle 12.8",
                                "Cle 12.8", "Cle 12.8", "Cle 12.8", "Cle 34", "Cle 34",
                                "Cle 34", "Cle 34", "Cle 12.8", "Cle 12.8", "Cle 12.8",
                                "Cle 12.8", "Cle 34", "Cle 34", "Cle 34", "Cle 34",
                                "Cle 12.8", "Cle 12.8", "Cle 12.8", "Cle 12.8", "Cle 34",
                                "Cle 34", "Cle 34", "Cle 34"),
                       adj = c("Without", "Without", "Without", "Without", "Without",
                               "Without", "Without", "Without", "With", "With", "With",
                               "With", "With", "With", "With", "With", "Without", "Without",
                               "Without", "Without", "Without", "Without", "Without", "Without",
                               "With", "With", "With", "With", "With", "With", "With", "With"),
                       dw1 = c(3.71, 5.87, 6.74, 1.65, 0.27, 0.4, 0.37, 0.34, 0.24, 0.28, 0.32,
                               0.38, 0.39, 0.36, 0.32, 0.28, 8.24, 10.18, 11.59, 6.18, 0.2, 0.23,
                               0.2, 0.31, 0.28, 0.25, 0.36, 0.27, 0.36, 0.37, 0.34, 0.19)), row.names = c(NA, -32L), class = c("tbl_df", "tbl", "data.frame"))

data$trat_adj<-paste(data$trat,data$adj,sep = "_")
data<-as.data.frame(data[-c(2,3)])
str(data)
#function
generate_label_df <- function(TUKEY, variable){

  # Extract labels and factor levels from Tukey post-hoc
  Tukey.levels <- variable[,4]
  Tukey.labels <- data.frame(multcompLetters(Tukey.levels)['Letters'])

  #I need to put the labels in the same order as in the boxplot :
  Tukey.labels$treatment=rownames(Tukey.labels)
  Tukey.labels=Tukey.labels[order(Tukey.labels$treatment) , ]
  return(Tukey.labels)
}

p <- ggplot(data=data, aes(x=data$trat_adj, y=data$dw1, fill=data$trat_adj)) +
  geom_boxplot(outlier.shape=NA) +
  facet_grid(~nozzle) +
  scale_fill_brewer(palette="Reds") +
  theme_minimal() +
  theme(legend.position="none") +
  theme(axis.text.x=element_text(angle=45, hjust=1))
p

for (facetk in as.character(unique(data$nozzle))) {
  subdf <- subset(data, nozzle==facetk)
  model=lm(dw1 ~ trat_adj, data=subdf)
  ANOVA=aov(model)
  TUKEY <- TukeyHSD(ANOVA)
  labels <- generate_label_df(TUKEY, TUKEY$trat_adj)

  names(labels) <- c('Letters','data$trat_adj')
  yvalue <- aggregate(subdf$dw1, list(subdf$trat_adj), data=subdf, quantile, probs=.75)

  final <- data.frame(labels, yvalue[,2])

  names(final)<-c("letters","trat_adj","dw1")
  final$nozzle <-  facetk

  p <- p + geom_text(data = final,  aes(x=trat_adj, y=dw1, fill=trat_adj,label=letters),
                     vjust=-1.5, hjust=-.5)
}
p
