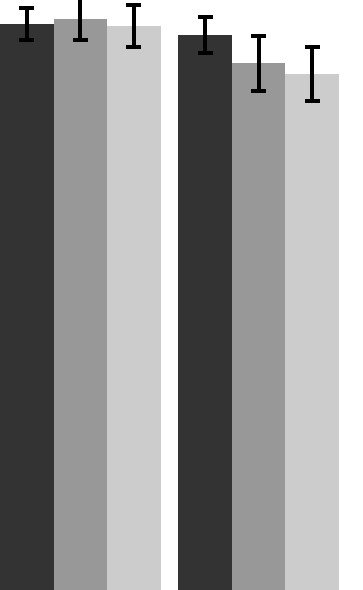
Добавить значение р из парного сравнения в каждой категории
library(tidyverse)
library(ggpubr)

df <- tibble(
  iq = rnorm(150, 100, 15),
  condition = rep(c("A", "B"), each = 75),
  time = rep(c("t1", "t2", "t3","t1", "t2","t3"), each = 25)
)
ggbarplot(df,
          x = "condition",
          y = "iq",
          fill = "time",
          palette = "grey",
          add = "mean_se", add.params = list(group = "time"),
          position = position_dodge(0.8)) +
  stat_compare_means(aes(group = time),label = "p.signif", paired = TRUE,
                     comparisons = list(c("t1", "t2"),
                                        c("t1", "t3"),
                                        c("t2", "t3")))
stat_compare_means() не может провести парное сравнение отдельно для каждой категории.
1 ответ
Может быть, этот код может помочь: вы можете сначала вычислить p-значения для каждого сравнения, а затем добавить их в график.
library(tidyverse)
if(!require(devtools)) install.packages("devtools")  devtools::install_github("kassambara/rstatix")
library(rstatix)
library(ggpubr)
stat.test <- df %>%   group_by(condition) %>%   t_test(iq ~ time) %>%   adjust_pvalue() %>%   add_significance("p.adj") %>%   mutate(y.position = 115)
stat.test

    ggbarplot(df,
              x = "time",
              y = "iq",
              facet.by = "condition",
              fill = "time",
              palette = "grey",
              add = "mean_se", add.params = list(group = "time"),
              position = position_dodge(0.8)) +   stat_pvalue_manual(stat.test,label = "p.adj", y.position = "y.position")
