Как совместить расположение строк и столбцов в flexdashboard?
Для нового проекта я хочу попробовать новый пакет flexdasboard. Я имею в виду планировку, в которой ориентация столбца и строки как-то сочетается.
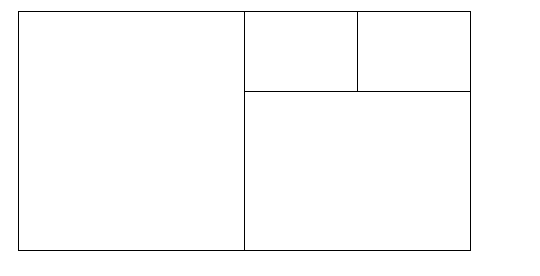
Макет, о котором я думаю, выглядит примерно так:
Если я изменю этот код:
---
title: "Focal Chart (Left)"
output: flexdashboard::flex_dashboard
---

Column {data-width=600}
-------------------------------------

### Chart 1

```{r}
```

Column {data-width=400}
-------------------------------------

### Chart 2

```{r}
```

### Chart 3

```{r}
```
в это:
---
title: "Focal Chart (Left)"
output: flexdashboard::flex_dashboard
---

Column {data-width=600}
-------------------------------------

### Chart 1

```{r}
```

Column {data-width=400}
-------------------------------------

Row {data-width=400}
-------------------------------------

### Chart 2

```{r}
```

### Chart 3

```{r}
```

Row {data-width=400}
-------------------------------------

### Chart 4

```{r}
```
(конечно), это не работает, но я не нашел правильный путь. У кого-нибудь есть идея?
4 ответа
Это не представляется возможным при использовании основных строк и столбцов, но может быть достигнуто с помощью боковой панели для хранения содержимого левой панели. Это изменит форматирование левой панели по сравнению с другими, но затем его внешний вид можно откорректировать по своему вкусу, отредактировав CSS. Обратите внимание, что вы можете изменить ширину боковой панели, используя опцию data-width, например {.sidebar data-width=300}
---
title: "Focal Chart"
output:
  flexdashboard::flex_dashboard:
    orientation: rows
---

Column {.sidebar data-width=500}
-------------------------------------
### Chart 1
```{r}
```

Row {data-height=350}
-------------------------------------
### Chart 2
```{r}
```

### Chart 3
```{r}
```

Row {data-height=650}
-------------------------------------
### Chart 4
```{r}
```
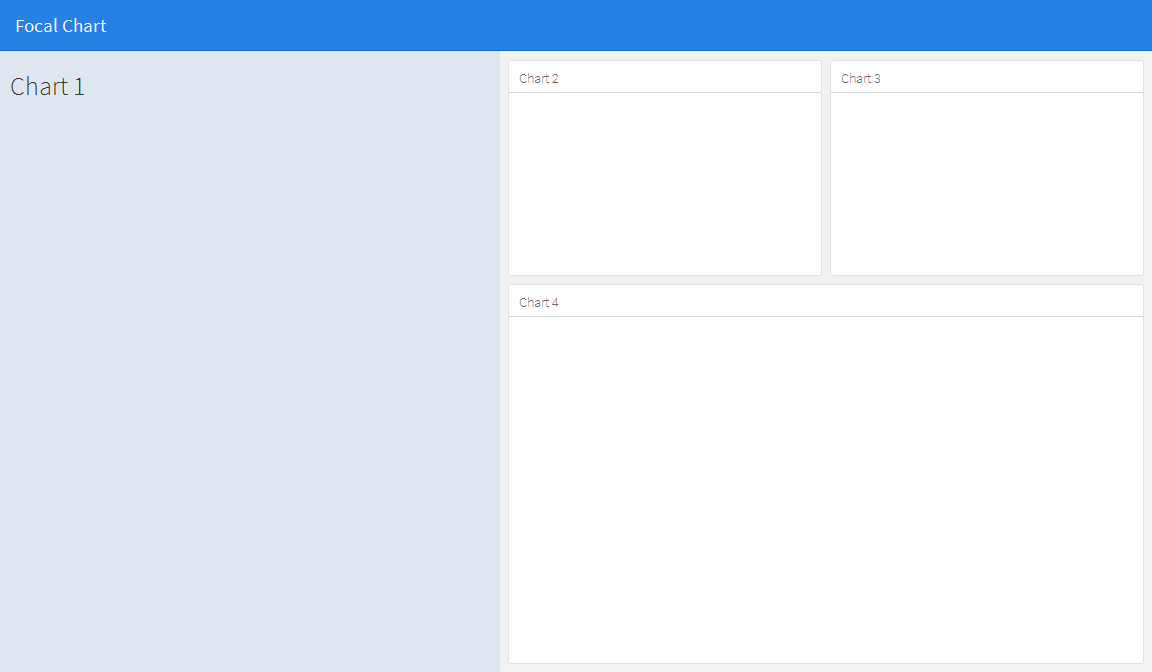
Который дает...
Внешний вид боковой панели затем можно отредактировать по своему вкусу. Например:
к
- изменить цвет фона боковой панели на белый (если вы хотите, чтобы он соответствовал другим панелям),
- совместите верхний край с другими панелями и
- добавить границы слева и снизу, чтобы соответствовать другим панелям:
отредактируйте таблицу стилей CSS для.section.sidebar, чтобы
.section.sidebar {
  top: 61px;
  border-bottom: 10px solid #ececec;
  border-left: 10px solid #ececec;
  background-color: rgba(255, 255, 255, 1);
}
Чтобы изменить заполнение, используйте параметр дополнения данными в уценке flexdashboard:
Column {.sidebar data-width=500 data-padding=10}
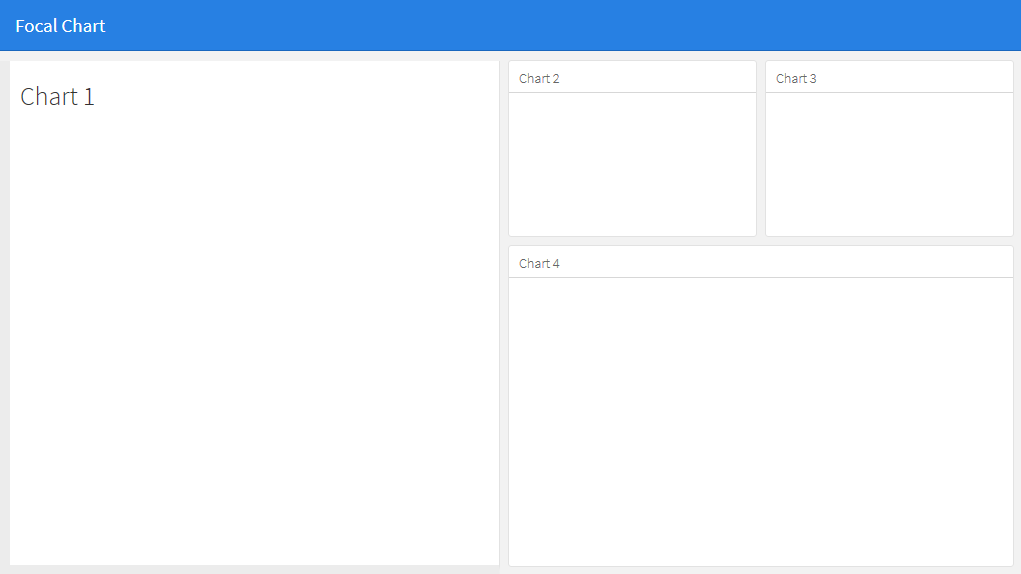
Теперь это выглядит так:
Что вам действительно нужно, так это fillCol а также fillRow функции. Посмотрите на это: http://shiny.rstudio.com/articles/gadget-ui.html
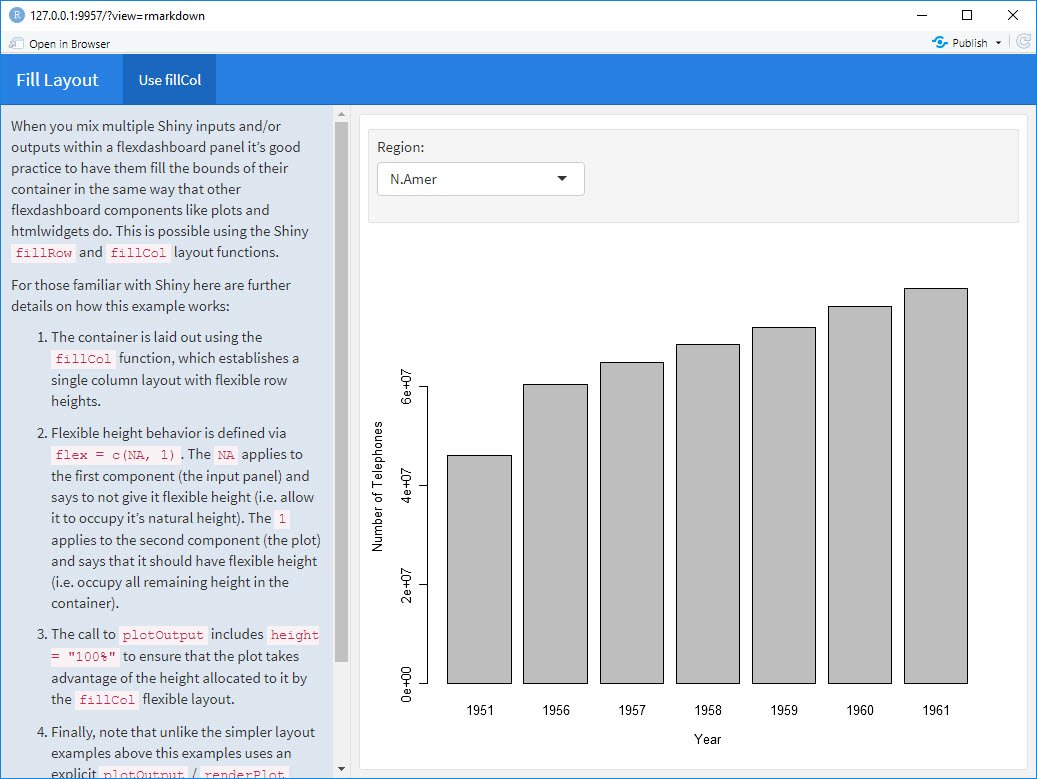
Я создал этот пример flexdashboard из того, что нашел на сайте Shiny+flex в RStudio, используя fillCol:
---
title: "Fill Layout"
output:
  flexdashboard::flex_dashboard:
    orientation: columns
runtime: shiny
---

# Info {.sidebar data-width=350}

When you mix multiple Shiny inputs and/or outputs within a flexdashboard panel it’s good practice to have them fill the bounds of their container in the same way that other flexdashboard components like plots and htmlwidgets do. This is possible using the Shiny `fillRow` and `fillCol` layout functions.

For those familiar with Shiny here are further details on how this example works:

1. The container is laid out using the `fillCol` function, which establishes a single column layout with flexible row heights.

2. Flexible height behavior is defined via `flex = c(NA, 1)`. The `NA` applies to the first component (the input panel) and says to not give it flexible height (i.e. allow it to occupy it’s natural height). The `1` applies to the second component (the plot) and says that it should have flexible height (i.e. occupy all remaining height in the container).

3. The call to `plotOutput` includes `height = "100%"` to ensure that the plot takes advantage of the height allocated to it by the `fillCol` flexible layout.

4. Finally, note that unlike the simpler layout examples above this examples uses an explicit  `plotOutput` / `renderPlot` pairing rather than just a standalone `renderPlot`. This is so that the plot can be included in a more sophisticated layout scheme (i.e. one more like traditional ui.R layout).

# Use fillCol

```{r}
fillCol(height = 600, flex = c(NA, 1),
  inputPanel(
    selectInput("region", "Region:", choices = colnames(WorldPhones))
  ),
  plotOutput("phonePlot", height = "100%")
)

output$phonePlot <- renderPlot({
  barplot(WorldPhones[,input$region]*1000,
          ylab = "Number of Telephones", xlab = "Year")
})
```
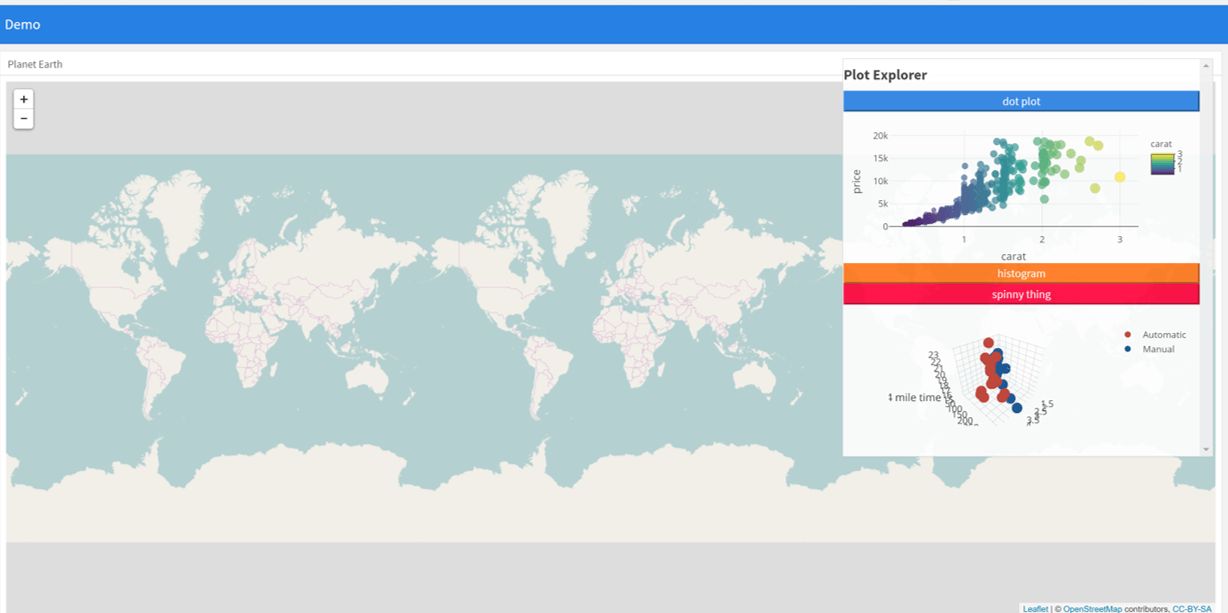
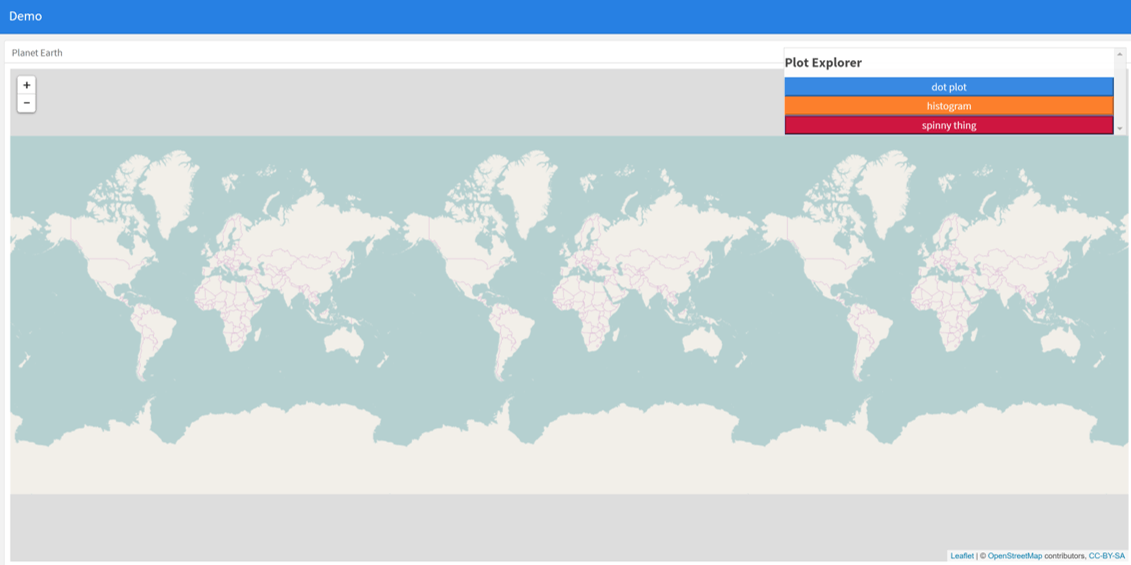
Альтернативным подходом может быть использование абсолютных панелей из блестящей. Вместо того, чтобы пытаться найти сетку для размещения всех элементов на экране, используйте абсолютную панель со складывающимися кнопками, чтобы выборочно выбирать, какие поля появляются в данный момент времени. Это позволяет пользователю выбирать, какие графики и информацию они хотят представить. Идея возникла из приложения superzip https://shiny.rstudio.com/gallery/superzip-example.html, но хорошо работает в flexdashboard.
В приведенном ниже примере графики могут отображаться или скрываться при загрузке страницы. Нажмите на кнопки, чтобы они появились или исчезли. Это было очень полезно при смешивании листовки с графиками, чтобы избежать утопления карты с графиками (где, как и прежде, графики были ограничены из-за проблем с утоплением).
---
  title: "Demo"
  output:
    flexdashboard::flex_dashboard:
      orientation: columns
      vertical_layout: fill
  ---


  ```{r setup, include=FALSE}
  library(flexdashboard)
  library(rmarkdown)
  library(plotly)
  library(shiny)

  ```

  Column {data-width=400}
  --------------------------------
  ### Planet Earth

  ```{r}

  library(leaflet)
  m = leaflet() %>% addTiles()
  m  # a map with the default OSM tile layer


  ```


  ```{r}
  #plot setup
  mtcars$am[which(mtcars$am == 0)] <- 'Automatic'
  mtcars$am[which(mtcars$am == 1)] <- 'Manual'
  mtcars$am <- as.factor(mtcars$am)

  p <- plot_ly(mtcars, x = ~wt, y = ~hp, z = ~qsec, color = ~am, colors = c('#BF382A', '#0C4B8E')) %>%
    add_markers() %>%
    layout(scene = list(xaxis = list(title = 'Weight'),
                       yaxis = list(title = 'Gross horsepower'),
                       zaxis = list(title = '1/4 mile time')))


  set.seed(100)
  d <- diamonds[sample(nrow(diamonds), 1000), ]


  ##########################
  absolutePanel(id = "controls", class = "panel panel-default", fixed = TRUE,
                draggable = TRUE, top = 70, left = "auto", right = 20, bottom = "auto",
                width = '30%', height = 'auto',
                style = "overflow-y:scroll; max-height: 1000px; opacity: 0.9; style = z-index: 400",

              h4(strong("Plot Explorer")),

      HTML('<button data-toggle="collapse" data-target="#box1" class="btn-block btn-primary">dot plot</button>'),
      tags$div(id = 'box1', class="collapse in",

        plot_ly(d, x = ~carat, y = ~price, color = ~carat,
          size = ~carat, text = ~paste("Clarity: ", clarity)) %>% layout(height=200)

              ),

   HTML('<button data-toggle="collapse" data-target="#box2" class="btn-block btn-warning">histogram</button>'),
      tags$div(id = 'box2', class="collapse",

         plot_ly(x = rnorm(500), type = "histogram", name = "Histogram") %>% layout(height=200)
      ),


           HTML('<button data-toggle="collapse" data-target="#box3" class="btn-block btn-danger">spinny thing</button>'),
      tags$div(id = 'box3', class="collapse in",

          p %>% layout(height=200)
      )

   )

  ```
