Matplotlib/Pandas: Zoom Часть графика с временными рядами
Моя задача проста: у меня есть временной ряд ts (Евро швейцарский франк ежедневный обменный курс между 2010 и 2014), чтобы построить. В этом сюжете я хотел бы выделить определенный интервал времени, увеличив его. Однако увеличенное окно остается просто пустым (см. Код ниже). Кроме того, у меня есть проблема с выбором x-диапазона увеличенного окна, так как я не знаю, как правильно преобразовать даты во внутреннее целочисленное представление matplotlib.
Заранее спасибо за помощь!
Вот мой код:
import numpy as np
import pandas as pd
from matplotlib import pyplot as plt
from mpl_toolkits.axes_grid1.inset_locator import zoomed_inset_axes
from mpl_toolkits.axes_grid1.inset_locator import mark_inset

# Load the time series
ts = pd.read_csv('./Data/EUR_CHF_Exchange_Rates/EUR_CHF_daily.csv',sep=';', parse_dates=['time'], index_col = 'time',decimal=',')
ts = ts['EUR/CHF']
ts = ts.sort_index(ascending=True)

# Plot
fig = plt.figure(figsize=(14,5))
ax = plt.axes()
ts.plot() # ts is my time series

# Label the axis
ax.set_xlabel('')
ax.set_ylabel('EUR/CHF')

#I want to select the x-range for the zoomed region. I have figured it out suitable values
# by trial and error. How can I pass more elegantly the dates as something like
# x1 = '2012-05-09'
# x2 = '2012-09-02'
x1 = 15439.0
x2 = 15588.0

# select y-range for zoomed region
y1 = 1.15
y2 = 1.25

# Make the zoom-in plot:
axins = zoomed_inset_axes(ax, 2, loc=1) # zoom = 2
axins.plot(ts)
axins.set_xlim(x1, x2)
axins.set_ylim(y1, y2)
plt.xticks(visible=False)
plt.yticks(visible=False)
mark_inset(ax, axins, loc1=2, loc2=4, fc="none", ec="0.5")
plt.draw()
plt.savefig('daily_exchange_rates.pdf') # The zoomed window is empty!!!!
1 ответ
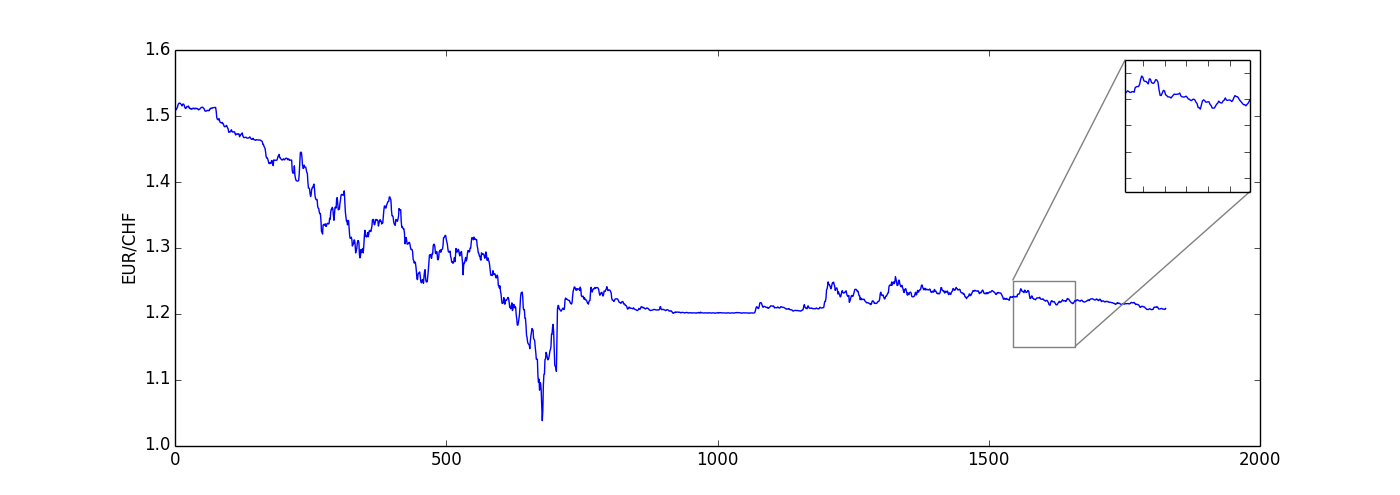
Я никогда не пользовалась pandasНо я думаю, что проблема в том, какой диапазон вы выбираете axins.set_xlim(x1, x2)кажется, что они находятся за пределами диапазона. Я просто использовал возможности построения matplotlib и изменил диапазон, и я получил изображение с увеличением.
import numpy as np
import pandas as pd
from matplotlib import pyplot as plt
from mpl_toolkits.axes_grid1.inset_locator import zoomed_inset_axes
from mpl_toolkits.axes_grid1.inset_locator import mark_inset

# Load the time series
ts = pd.read_csv('EUR_CHF_daily.csv',sep=';', parse_dates=['time'], index_col = 'time',decimal=',')
ts = ts['EUR/CHF']
ts = ts.sort_index(ascending=True)

# Plot
fig = plt.figure(figsize=(14,5))
ax = plt.axes()
ax.plot(ts)

# Label the axis
ax.set_xlabel('')
ax.set_ylabel('EUR/CHF')

#I want to select the x-range for the zoomed region. I have figured it out suitable values
# by trial and error. How can I pass more elegantly the dates as something like
x1 = 1543.90
x2 = 1658.80

# select y-range for zoomed region
y1 = 1.15
y2 = 1.25

# Make the zoom-in plot:
axins = zoomed_inset_axes(ax, 2, loc=1) # zoom = 2
axins.plot(ts)
axins.set_xlim(x1, x2)
axins.set_ylim(y1, y2)
plt.xticks(visible=False)
plt.yticks(visible=False)
mark_inset(ax, axins, loc1=2, loc2=4, fc="none", ec="0.5")
plt.draw()
plt.show()