Кубический отшельник интерполяционный питон
Я хотел бы вычислить полином третьей степени, который определяется значениями его функций и производными в указанных точках.
https://en.wikipedia.org/wiki/Cubic_Hermite_spline
Я знаю методы интерполяции Сципи. конкретно
splprep для интерполяции N-мерного сплайна и splev для выявления его производных.
Существует ли подпрограмма Python, которая принимает значения функций f(x) и производные f'(x), соответствующие значениям x, и вычисляет представление сплайна, которое соответствует заданным данным.
Чтобы привести пример:
У меня есть две позиции объекта в пространстве, определенные координатами x, y,z, и я знаю скорость x',y',z' объекта в этих позициях. Могу ли я теперь интерполировать путь, по которому объект проходит между двумя точками за время t. С учетом всех заданных параметров.
2 ответа
Ты можешь использовать BPoly.from_derivatives, Результатом является полином по базису Бернштейна.
Расширяя ответ ev-br, приведу пример кода, который иллюстрирует использование BPoly.from_derivatives интерполировать между точками по n измерениям с заданными производными.
import numpy as np
from scipy import interpolate

def sampleCubicSplinesWithDerivative(points, tangents, resolution):
    '''
    Compute and sample the cubic splines for a set of input points with
    optional information about the tangent (direction AND magnitude). The
    splines are parametrized along the traverse line (piecewise linear), with
    the resolution being the step size of the parametrization parameter.
    The resulting samples have NOT an equidistant spacing.

    Arguments:      points: a list of n-dimensional points
                    tangents: a list of tangents
                    resolution: parametrization step size
    Returns:        samples

    Notes: Lists points and tangents must have equal length. In case a tangent
           is not specified for a point, just pass None. For example:
                    points = [[0,0], [1,1], [2,0]]
                    tangents = [[1,1], None, [1,-1]]

    '''
    resolution = float(resolution)
    points = np.asarray(points)
    nPoints, dim = points.shape

    # Parametrization parameter s.
    dp = np.diff(points, axis=0)                 # difference between points
    dp = np.linalg.norm(dp, axis=1)              # distance between points
    d = np.cumsum(dp)                            # cumsum along the segments
    d = np.hstack([[0],d])                       # add distance from first point
    l = d[-1]                                    # length of point sequence
    nSamples = int(l/resolution)                 # number of samples
    s,r = np.linspace(0,l,nSamples,retstep=True) # sample parameter and step

    # Bring points and (optional) tangent information into correct format.
    assert(len(points) == len(tangents))
    data = np.empty([nPoints, dim], dtype=object)
    for i,p in enumerate(points):
        t = tangents[i]
        # Either tangent is None or has the same
        # number of dimensions as the point p.
        assert(t is None or len(t)==dim)
        fuse = list(zip(p,t) if t is not None else zip(p,))
        data[i,:] = fuse

    # Compute splines per dimension separately.
    samples = np.zeros([nSamples, dim])
    for i in range(dim):
        poly = interpolate.BPoly.from_derivatives(d, data[:,i])
        samples[:,i] = poly(s)
    return samples
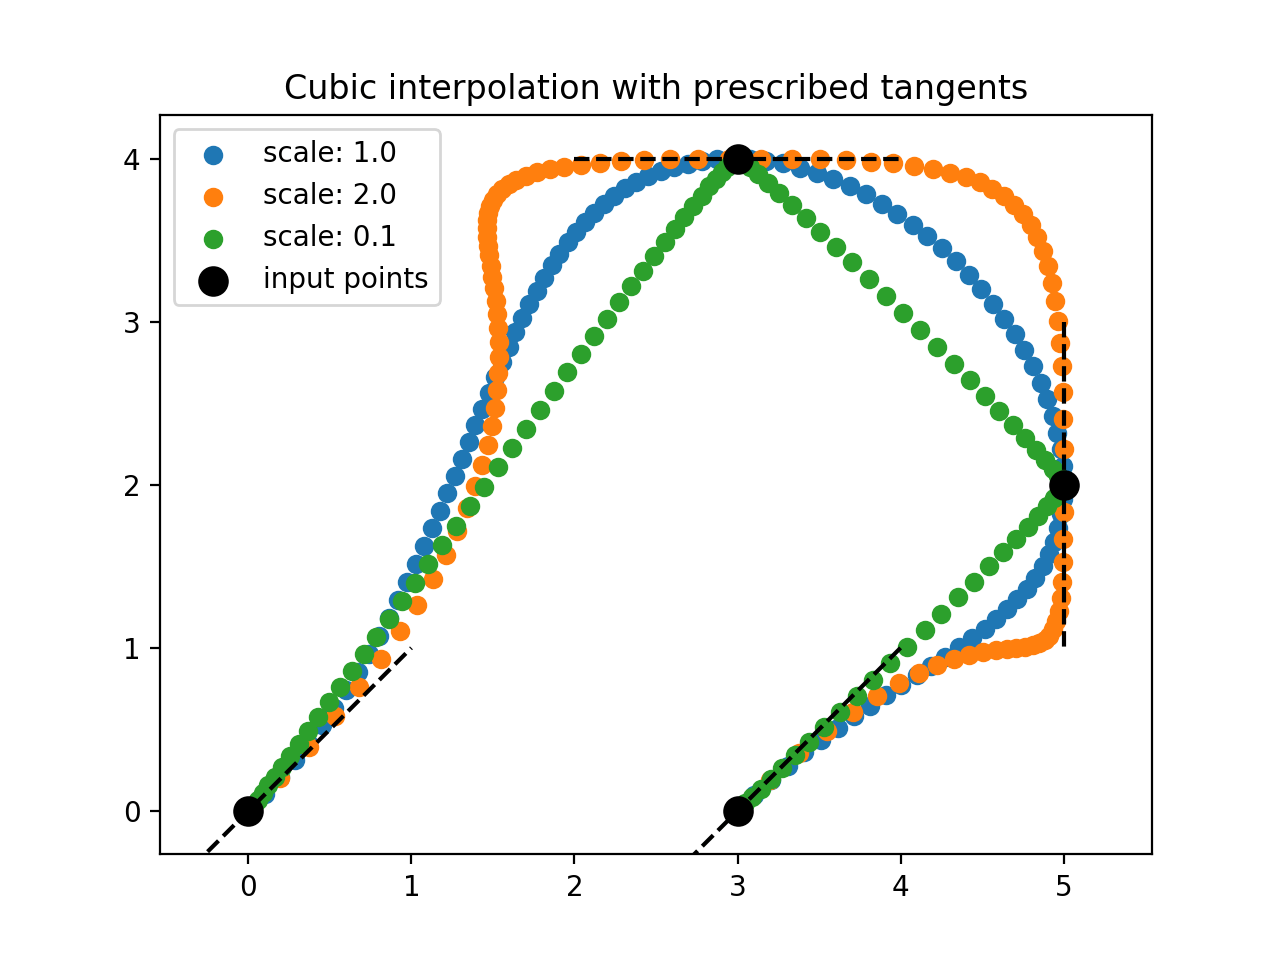
Чтобы продемонстрировать использование этой функции, мы указываем точки и касательные. Этот пример дополнительно демонстрирует эффект изменения "величины" касательных.
# Input.
points = []
tangents = []
resolution = 0.2
points.append([0.,0.]); tangents.append([1,1])
points.append([3.,4.]); tangents.append([1,0])
points.append([5.,2.]); tangents.append([0,-1])
points.append([3.,0.]); tangents.append([-1,-1])
points = np.asarray(points)
tangents = np.asarray(tangents)

# Interpolate with different tangent lengths, but equal direction.
scale = 1.
tangents1 = np.dot(tangents, scale*np.eye(2))
samples1 = sampleCubicSplinesWithDerivative(points, tangents1, resolution)
scale = 2.
tangents2 = np.dot(tangents, scale*np.eye(2))
samples2 = sampleCubicSplinesWithDerivative(points, tangents2, resolution)
scale = 0.1
tangents3 = np.dot(tangents, scale*np.eye(2))
samples3 = sampleCubicSplinesWithDerivative(points, tangents3, resolution)

# Plot.
import matplotlib.pyplot as plt
plt.scatter(samples1[:,0], samples1[:,1], marker='o', label='samples1')
plt.scatter(samples2[:,0], samples2[:,1], marker='o', label='samples2')
plt.scatter(samples3[:,0], samples3[:,1], marker='o', label='samples3')
plt.scatter(points[:,0], points[:,1], s=100, c='k', label='input')
plt.axis('equal')
plt.title('Interpolation')
plt.legend()
plt.show()
Это приводит к следующему сюжету: 
Три вещи на заметку:
- Следующее может также применяться для более чем двух измерений.
- Расстояние между образцами не фиксировано. Одним из простых способов достижения эквидистантной выборки является линейная интерполяция между
samples, как это обсуждалось, например, в этом посте. - Спецификация касательных является необязательной, однако
BPoly.from_derivativesне обеспечивает плавных переходов между сплайнами в этой позиции. Если напримерtangents[1]в приведенном выше примере установленоNone,sampleCubicSplinesWithDerivative(points, tangents, resolution), результат будет выглядеть так: