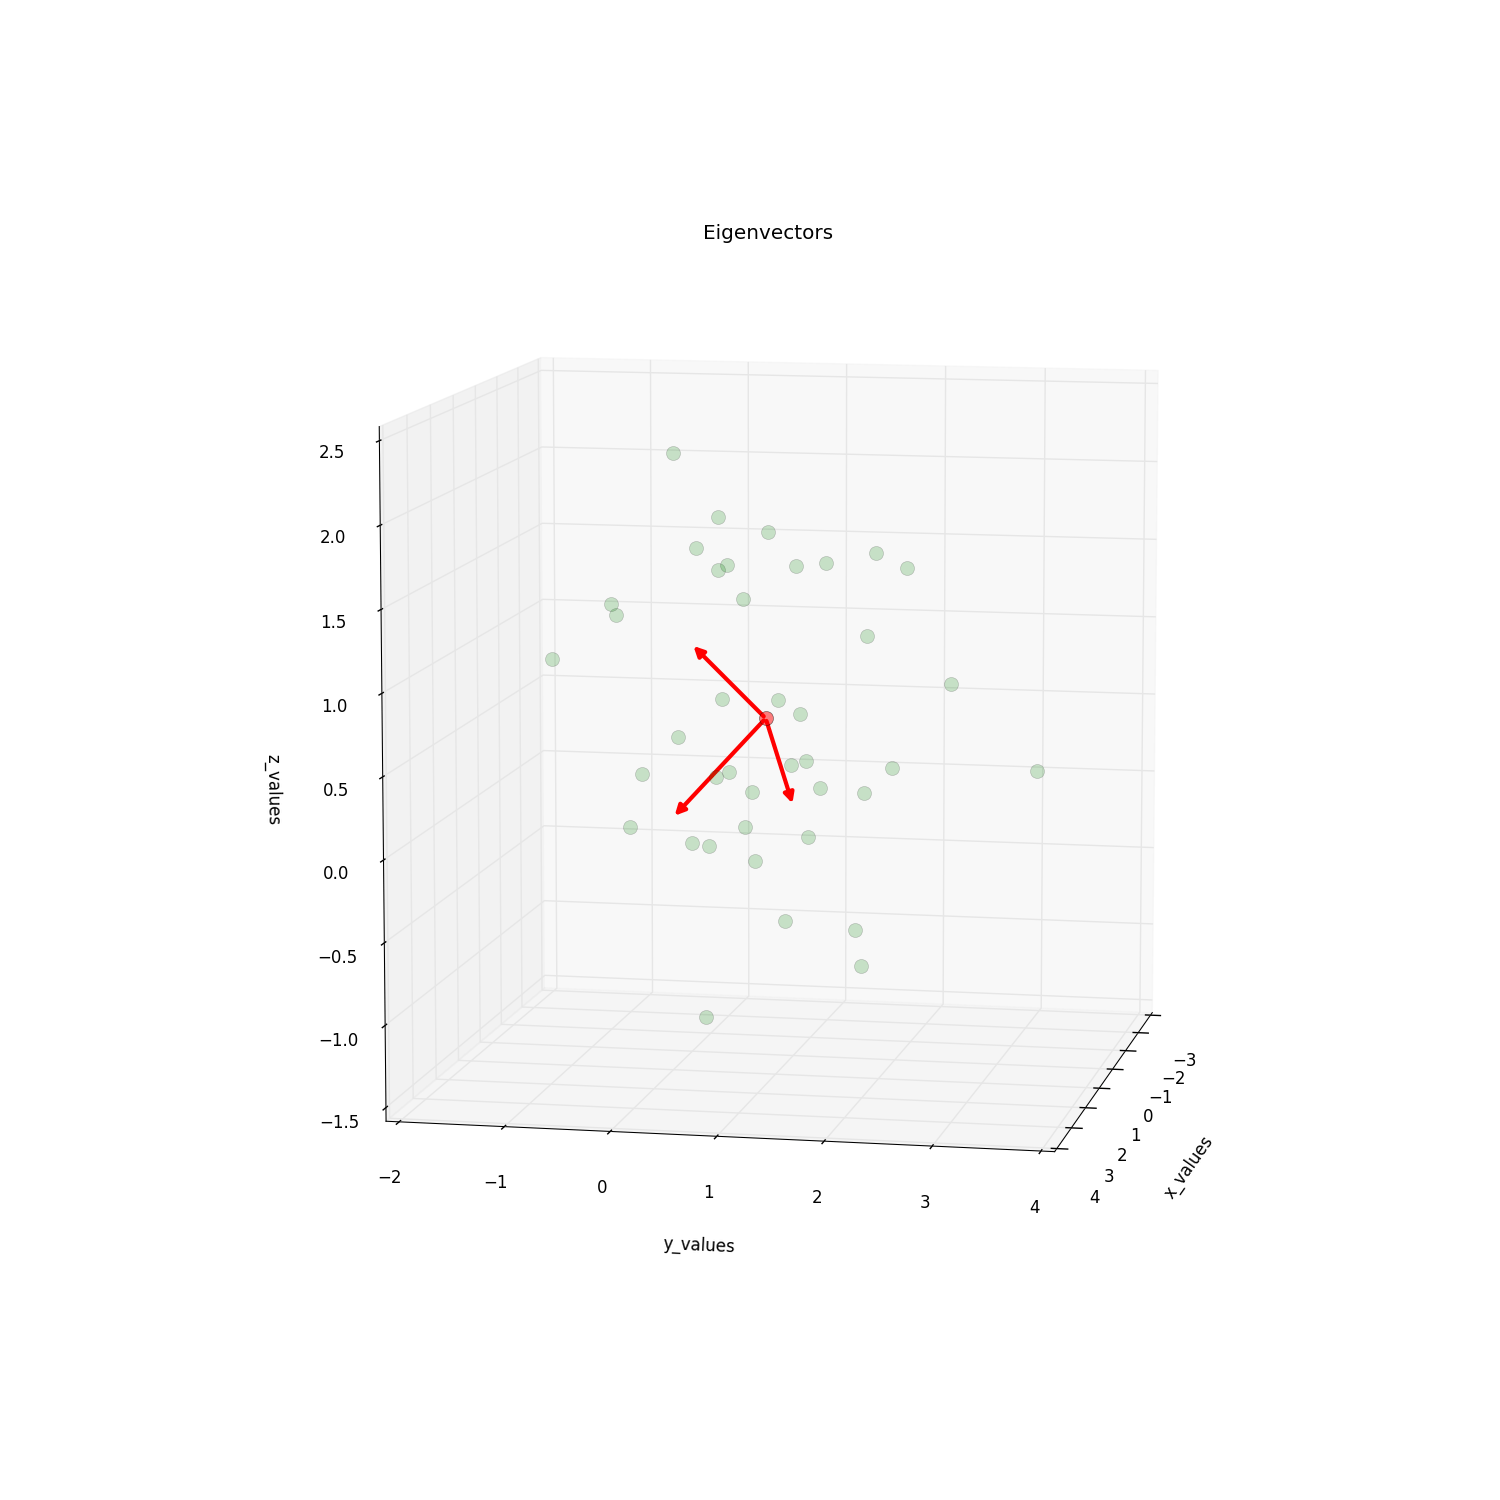
Помещение стрелок в векторы на 3D-графике Matplotlib
Я построил собственные векторы некоторых 3D-данных и подумал, а есть ли в настоящее время (уже) способ поставить стрелки на линиях? Было бы здорово, если бы у меня был совет для меня. 
import numpy as np
from matplotlib import pyplot as plt
from mpl_toolkits.mplot3d import Axes3D

####################################################
# This part is just for reference if
# you are interested where the data is
# coming from
# The plot is at the bottom
#####################################################

# Generate some example data
mu_vec1 = np.array([0,0,0])
cov_mat1 = np.array([[1,0,0],[0,1,0],[0,0,1]])
class1_sample = np.random.multivariate_normal(mu_vec1, cov_mat1, 20)

mu_vec2 = np.array([1,1,1])
cov_mat2 = np.array([[1,0,0],[0,1,0],[0,0,1]])
class2_sample = np.random.multivariate_normal(mu_vec2, cov_mat2, 20)

# concatenate data for PCA
samples = np.concatenate((class1_sample, class2_sample), axis=0)

# mean values
mean_x = mean(samples[:,0])
mean_y = mean(samples[:,1])
mean_z = mean(samples[:,2])

#eigenvectors and eigenvalues
eig_val, eig_vec = np.linalg.eig(cov_mat)

################################
#plotting eigenvectors
################################

fig = plt.figure(figsize=(15,15))
ax = fig.add_subplot(111, projection='3d')

ax.plot(samples[:,0], samples[:,1], samples[:,2], 'o', markersize=10, color='green', alpha=0.2)
ax.plot([mean_x], [mean_y], [mean_z], 'o', markersize=10, color='red', alpha=0.5)
for v in eig_vec:
    ax.plot([mean_x, v[0]], [mean_y, v[1]], [mean_z, v[2]], color='red', alpha=0.8, lw=3)
ax.set_xlabel('x_values')
ax.set_ylabel('y_values')
ax.set_zlabel('z_values')

plt.title('Eigenvectors')

plt.draw()
plt.show()
3 ответа
Чтобы добавить патчи стрелок к трехмерному графику, простое решение заключается в использовании FancyArrowPatch класс, определенный в /matplotlib/patches.py, Тем не менее, он работает только для 2D-графика (на момент написания), так как его posA а также posB должны быть кортежей длины 2.
Поэтому мы создаем новый класс патча со стрелкой, назовите его Arrow3D, который наследует от FancyArrowPatch, Единственное, что нам нужно, это переопределить posA а также posB, Для этого мы инициируем Arrow3d с posA а также posB из (0,0)s. 3D координаты xs, ys, zs затем был спроецирован из 3D в 2D с использованием proj3d.proj_transform()и результирующие 2D координаты присваиваются posA а также posB с помощью .set_position() метод, заменив (0,0)s. Таким образом, мы заставим 3D стрелку работать.
Шаги проекции идут в .draw метод, который переопределяет .draw метод FancyArrowPatch объект.
Это может выглядеть как взломать. Тем не менее mplot3d в настоящее время обеспечивает (опять же, только) простую объемную трехмерную графику, предоставляя проекции 3D-2D, и, по сути, выполняет всю графику в 2D, которая в действительности не является трехмерной.
import numpy as np
from numpy import *
from matplotlib import pyplot as plt
from mpl_toolkits.mplot3d import Axes3D
from matplotlib.patches import FancyArrowPatch
from mpl_toolkits.mplot3d import proj3d

class Arrow3D(FancyArrowPatch):
    def __init__(self, xs, ys, zs, *args, **kwargs):
        FancyArrowPatch.__init__(self, (0,0), (0,0), *args, **kwargs)
        self._verts3d = xs, ys, zs

    def draw(self, renderer):
        xs3d, ys3d, zs3d = self._verts3d
        xs, ys, zs = proj3d.proj_transform(xs3d, ys3d, zs3d, renderer.M)
        self.set_positions((xs[0],ys[0]),(xs[1],ys[1]))
        FancyArrowPatch.draw(self, renderer)

####################################################
# This part is just for reference if
# you are interested where the data is
# coming from
# The plot is at the bottom
#####################################################

# Generate some example data
mu_vec1 = np.array([0,0,0])
cov_mat1 = np.array([[1,0,0],[0,1,0],[0,0,1]])
class1_sample = np.random.multivariate_normal(mu_vec1, cov_mat1, 20)

mu_vec2 = np.array([1,1,1])
cov_mat2 = np.array([[1,0,0],[0,1,0],[0,0,1]])
class2_sample = np.random.multivariate_normal(mu_vec2, cov_mat2, 20)
Актуальный рисунок. Обратите внимание, что нам нужно изменить только одну строку вашего кода, чтобы добавить нового художника стрелки:
# concatenate data for PCA
samples = np.concatenate((class1_sample, class2_sample), axis=0)

# mean values
mean_x = mean(samples[:,0])
mean_y = mean(samples[:,1])
mean_z = mean(samples[:,2])

#eigenvectors and eigenvalues
eig_val, eig_vec = np.linalg.eig(cov_mat1)

################################
#plotting eigenvectors
################################

fig = plt.figure(figsize=(15,15))
ax = fig.add_subplot(111, projection='3d')

ax.plot(samples[:,0], samples[:,1], samples[:,2], 'o', markersize=10, color='g', alpha=0.2)
ax.plot([mean_x], [mean_y], [mean_z], 'o', markersize=10, color='red', alpha=0.5)
for v in eig_vec:
    #ax.plot([mean_x,v[0]], [mean_y,v[1]], [mean_z,v[2]], color='red', alpha=0.8, lw=3)
    #I will replace this line with:
    a = Arrow3D([mean_x, v[0]], [mean_y, v[1]],
                [mean_z, v[2]], mutation_scale=20,
                lw=3, arrowstyle="-|>", color="r")
    ax.add_artist(a)
ax.set_xlabel('x_values')
ax.set_ylabel('y_values')
ax.set_zlabel('z_values')

plt.title('Eigenvectors')

plt.draw()
plt.show()

Пожалуйста, проверьте этот пост, который вдохновил этот вопрос, для получения дополнительной информации.
Другой вариант: вы также можете использовать plt.quiver функция, которая позволяет довольно легко создавать векторы стрелок без какого-либо дополнительного импорта или классов.
Чтобы воспроизвести ваш пример, вы должны заменить:
for v in eig_vec:
    ax.plot([mean_x, v[0]], [mean_y, v[1]], [mean_z, v[2]], color='red', alpha=0.8, lw=3)
с:
for v in eig_vec:
    ax.quiver(
        mean_x, mean_y, mean_z, # <-- starting point of vector
        v[0] - mean_x, v[1] - mean_y, v[2] - mean_z, # <-- directions of vector
        color = 'red', alpha = .8, lw = 3,
    )
Более новая версия бросков matplotlibAttributeError: 'Arrow3D' object has no attribute 'do_3d_projection'со старым определениемArrow3D. Это было задано здесь несколькими комментариями и все еще оставалось неясным. Вы должны добавить функциюdo_3d_projection(), покаdraw()больше не нужен. Текущий код выглядит так:
      import numpy as np
from matplotlib import pyplot as plt
from mpl_toolkits.mplot3d import Axes3D
from matplotlib.patches import FancyArrowPatch
from mpl_toolkits.mplot3d import proj3d

class Arrow3D(FancyArrowPatch):
    def __init__(self, xs, ys, zs, *args, **kwargs):
        super().__init__((0,0), (0,0), *args, **kwargs)
        self._verts3d = xs, ys, zs

    def do_3d_projection(self, renderer=None):
        xs3d, ys3d, zs3d = self._verts3d
        xs, ys, zs = proj3d.proj_transform(xs3d, ys3d, zs3d, self.axes.M)
        self.set_positions((xs[0],ys[0]),(xs[1],ys[1]))

        return np.min(zs)

fig = plt.figure()
ax = fig.add_subplot(111, projection='3d')
arrow_prop_dict = dict(mutation_scale=20, arrowstyle='-|>', color='k', shrinkA=0, shrinkB=0)
a = Arrow3D([0, 10], [0, 0], [0, 0], **arrow_prop_dict)
ax.add_artist(a)

plt.show()
Помощь пришла с гитхаба .