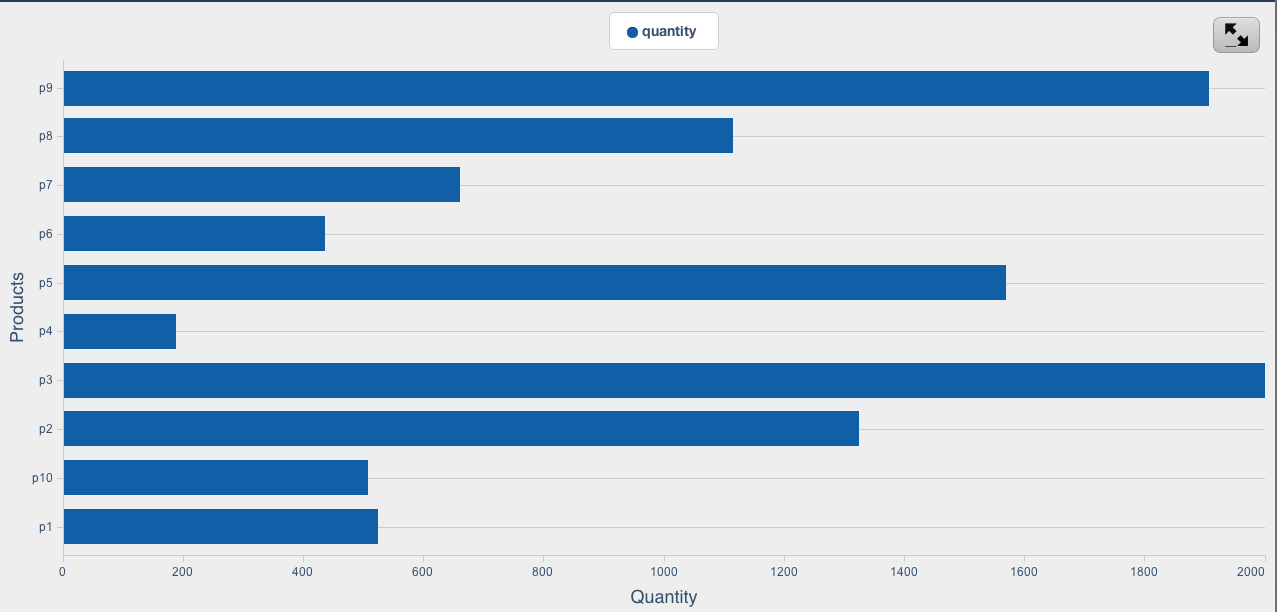
Придайте разный цвет каждому элементу категории на линейчатой диаграмме Sencha
Я вроде застрял с этой вещью. То, что я хочу сделать, это дать каждому столбцу на диаграмме сенча свой цвет. Это то, что я до сих пор: И это мой код для этого:
Ext.setup({
    tabletStartupScreen: 'tablet_startup.jpg',
    phoneStartupScreen: 'phone_startup.jpg',
    tabletIcon: 'icon-ipad.png',
    phoneIcon: 'icon-iphone.png',
    glossOnIcon: false,
    onReady: function() {
    Ext.regModel('Retail', {
        fields: [
        {name: 'id', type: 'string'},
        {name: 'quantity',  type: 'int'}
        ]
    });

   var retailStore =  new Ext.data.JsonStore({
        model: 'Retail',
        proxy: {
            type: 'ajax',
            url: 'getData.php',
            reader: {
                type: 'json',
            }
        },
        autoLoad: true
   });


   console.log(retailStore);


    new Ext.chart.Panel({
        id: 'chartCmp',
        title: 'Stock Example',
        fullscreen: true,
        dockedItems: {
            xtype: 'button',
            iconCls: 'shuffle',
            iconMask: true,
            ui: 'plain',
            dock: 'left'
        },
        items: {
            cls: 'stock1',
            theme: 'Demo',
            legend: {
                position: {
                    portrait: 'right',
                    landscape: 'top'
                },
                labelFont: '17px Arial'
            },
            interactions: [{
                type: 'panzoom',
                axes: {
                    left: {
                        maxZoom: 2
                    },
                    bottom: {
                        maxZoom: 4
                    }
                }
            }],
            animate: false,
            store: retailStore,
            axes: [{
                type: 'Numeric',
                position: 'bottom',
                fields: ['quantity'],
                title: 'Quantity'
            }, {
                type: 'Category',
                position: 'left',
                fields: ['id'],
                title: 'Products'
            }],
            series: [{
                type: 'bar',
                axis: 'right',
                xField: 'id',
                yField: ['quantity'],
            }]
        }
    });
}});
Я знаю, что должен быть какой-то способ "обмануть" диаграмму, добавив к ней дополнительное измерение, как это делается здесь: http://dev.sencha.com/deploy/touch-charts-1.0.0/examples/Bar/
Там каждый год представляет новый продукт. Я хотел бы сделать то же самое с моим, каждый продукт представляет разные измерения.
1 ответ
Вы можете использовать функцию рендеринга серии. Вы просто должны изменить attributes.fill в цвет, который вы хотите для каждого бара. Вот пример: http://bl.ocks.org/3511876 и код:
Ext.setup({
    onReady: function() {
        var data = [];

        for (var i = 0; i < 10; i++) {
            data.push({
                x: i,
                y: parseInt(Math.random() * 100)
            });
        }

        var colors = ['blue', 'yellow', 'red', 'green', 'gray'];

        var store = new Ext.data.JsonStore({
            fields: ['x', 'y'],
            data: data
        });

        var chart = new Ext.chart.Chart({
            store: store,
            axes: [{
                type: 'Category',
                fields: ['x'],
                position: 'left'
            }, {
                type: 'Numeric',
                fields: ['y'],
                position: 'bottom'
            }],
            series: [{
                type: 'bar',
                xField: 'x',
                yField: 'y',
                axis: 'bottom',
                renderer: function(sprite, record, attributes, index, store) {
                    attributes.fill = colors[index%colors.length];

                    return attributes;
                }
            }]
        });

        new Ext.chart.Panel({
            fullscreen: true,
            chart: chart
        });

        chart.redraw();
    }
});