Создание смещений полигонов с помощью Clipper lib в python
Я хочу произвести смещение в замкнутых многоугольниках, используя Clipper lib ( http://www.angusj.com/delphi/clipper.php).
Поскольку я использую Python 2.7, я использую pyclipper ( https://pypi.python.org/pypi/pyclipper), чтобы сделать то же самое.
К сожалению, я не могу понять из примера смещения многоугольника Clipper в C++:
 #include "clipper.hpp"
    ...
    using namespace ClipperLib;

    int main()
    {
      Path subj;
      Paths solution;
      subj <<
        IntPoint(348,257) << IntPoint(364,148) << IntPoint(362,148) <<
        IntPoint(326,241) << IntPoint(295,219) << IntPoint(258,88) <<
        IntPoint(440,129) << IntPoint(370,196) << IntPoint(372,275);
      ClipperOffset co;
      co.AddPath(subj, jtRound, etClosedPolygon);
      co.Execute(solution, -7.0);

      //draw solution ...
      DrawPolygons(solution, 0x4000FF00, 0xFF009900);
    }
Чтобы реализовать то же самое в Python.
Я видел только один пример (отсечения, а не смещения) Pyclipper:
import pyclipper

subj = (
    ((180, 200), (260, 200), (260, 150), (180, 150)),
    ((215, 160), (230, 190), (200, 190))
)
clip = ((190, 210), (240, 210), (240, 130), (190, 130))

pc = pyclipper.Pyclipper()
pc.AddPath(clip, pyclipper.PT_CLIP, True)
pc.AddPaths(subj, pyclipper.PT_SUBJ, True)

solution = pc.Execute(pyclipper.CT_INTERSECTION, pyclipper.PFT_EVENODD, pyclipper.PFT_EVENODD )
К сожалению, не будучи опытным программистом, я не смог продвинуться вперед.
Пожалуйста, помогите мне в этом отношении.
Заранее спасибо.
1 ответ
То же самое в pyclipper будет:
subj = ((348, 257), (364, 148), (362, 148), (326, 241), (295, 219), (258, 88), (440, 129), (370, 196), (372, 275))

pco = pyclipper.PyclipperOffset()
pco.AddPath(subj, pyclipper.JT_ROUND, pyclipper.ET_CLOSEDPOLYGON)
pco.Execute(-7.0)

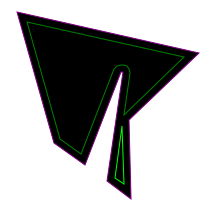
""" Result (2 polygons, see image below):
[[[365, 260], [356, 254], [363, 202]], [[425, 133], [365, 191], [371, 149], [370, 145], [368, 142], [364, 141], [362, 141], [358, 142], [355, 145], [322, 230], [301, 215], [268, 98]]]
"""
Мы постарались сохранить наименование методов и функций pyclipper как можно ближе к оригиналу для оболочки Python. Также способ, которым это предполагается использовать с имитацией базовой библиотеки. Единственная большая разница в пути Execute функции используются, как объяснено здесь pyclipper - Как использовать.
Вы можете проверить тесты, чтобы лучше понять использование.
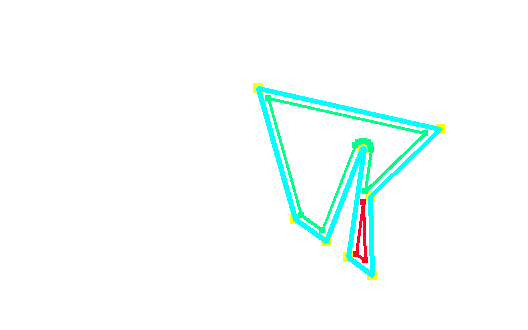
Ниже приведена демонстрация Python,
и он покажет изображение, чтобы вы лучше понимали, что происходит.
       from typing import List, Tuple
import pyclipper
import numpy as np
import cv2
from grid_extractor import show_img  # pip install grid_extractor  # Don't worry. It's a simple library. I am lazy, so I don't want to write a lot of things that is not what I cared, so I use a library that I publish to PyPI instead of it.

from matplotlib.colors import LinearSegmentedColormap
import matplotlib._cm
import matplotlib.pyplot


def main():
    point_list = (
        (348, 257), (364, 148), (362, 148), (326, 241),
        (295, 219), (258, 88), (440, 129), (370, 196),
        (372, 275)
    )
    img = init_canvas(max([x for x, y in point_list]), max([y for x, y in point_list]))
    # Show original data on the image
    draw_point_list(img, point_list, bgr_color=(0, 255, 255), size=5)
    draw_line(img, point_list, (255, 255, 0), thickness=3)
    # show_img(img)

    # Show the result after `pco.Execute`
    pco = pyclipper.PyclipperOffset()
    pco.AddPath(point_list, pyclipper.JT_ROUND, pyclipper.ET_CLOSEDPOLYGON)
    contours_list: List[List[Tuple[int, int]]] = pco.Execute(-7.0)  # - shrink the outline

    dot_thickness = 3
    line_thickness = 2
    bgr_color_list = get_color_list('gist_rainbow', num_colors=len(contours_list))
    for contours, color in zip(contours_list, bgr_color_list):
        color = np.array(list(color)) * 255
        print(f'number of points found: {len(contours)}')

        draw_point_list(img, contours, color, dot_thickness)
        draw_line(img, contours, color, line_thickness)
    show_img(img)


if __name__ == '__main__':
    main()
изображение результата
дополнительный код
Я не хочу сразу делать код слишком длинным (может вызвать нежелание пользователя читать), поэтому я решил поместить сюда не важный код. Если вы хотите бежать, просто соберите все вместе и бегите, готово.
       def get_color_list(cmap_name: str, num_colors: int, ft='bgr') -> List[Tuple[float, float, float]]:
    """
    ::

        bgr_list = get_color_list(cmap_name='gist_rainbow', num_colors=120)
        rgb_list = get_color_list(cmap_name='gist_rainbow', num_colors=120, ft='rgb')

        for color in bgr_list:
            color = np.array(list(color)) * 255
    """
    assert cmap_name in matplotlib._cm.datad, KeyError(cmap_name)
    cm: LinearSegmentedColormap = matplotlib.pyplot.get_cmap(cmap_name)
    color_list = [(int(b * 255) / 255, int(g * 255) / 255, int(r * 255) / 255) if ft == 'bgr' else
                  (int(r * 255) / 255, int(g * 255) / 255, int(b * 255) / 255)
                  for r, g, b, a in
                  [cm.__call__(1. * i / num_colors) for i in range(num_colors)]
                  ]
    return color_list  # some kind of stuff like that `[(1, 0, 0), (0, 1, 0) ...]`


def init_canvas(max_x: int, max_y: int) -> np.ndarray:
    img = np.ones((int(max_y * 1.2), int(max_x * 1.2), 3),  # 1.2 is margin
                  dtype=np.uint8) * 255  # fill the background with white color
    return img


def draw_point_list(img, point_list, bgr_color: Tuple[int, int, int], size):
    for x, y in point_list:
        img[int(y - size):int(y + size), int(x - size): int(x + size)] = bgr_color


def draw_line(img, point_list, bgr_color: Tuple[int, int, int], thickness, close_flag=True):
    """
    draw a line which cross every points.
    """
    begin_point = point_list[0]
    for i, (x, y) in enumerate(point_list):
        if i == 0:
            continue
        end_point = (x, y)
        cv2.line(img, tuple(begin_point), end_point, bgr_color, thickness)
        begin_point = end_point
    if close_flag:
        cv2.line(img, tuple(begin_point), tuple(point_list[0]), bgr_color, thickness)

