Создать ROC-кривую в Eclipse(weka)
Я использовал следующий код для обучения / тестирования некоторых классификаторов:
public class WekaTest {
  public static BufferedReader readDataFile(String filename)
  {
    BufferedReader inputReader = null;
    try
    {
        inputReader = new BufferedReader(new FileReader(filename));
    }
    catch (FileNotFoundException ex)
    {
        System.err.println("File not found: " + filename);
    }

    return inputReader;
}

public static Evaluation classify(Classifier model,
        Instances trainingSet, Instances testingSet) throws Exception {
    Evaluation evaluation = new Evaluation(trainingSet);

    model.buildClassifier(trainingSet);
    evaluation.evaluateModel(model, testingSet);

    return evaluation;
}

public static double calculateAccuracy(FastVector predictions) {
    double correct = 0;

    for (int i = 0; i < predictions.size(); i++) {
        NominalPrediction np = (NominalPrediction) predictions.elementAt(i);
        if (np.predicted() == np.actual()) {
            correct++;
        }
    }

    return 100 * correct / predictions.size();
}

public static Instances[][] crossValidationSplit(Instances data, int numberOfFolds) {
    Instances[][] split = new Instances[2][numberOfFolds];
    Random random = new Random();
    for (int i = 0; i < numberOfFolds; i++)
    {
        split[0][i] = data.trainCV(numberOfFolds, i, random);
        split[1][i] = data.testCV(numberOfFolds, i);
    }

    return split;
}


    public static void main(String[] args) throws Exception
    {
        BufferedReader datafile = readDataFile("training_1.arff");

        Instances data = new Instances(datafile);
        data.setClassIndex(data.numAttributes() - 1);

        // Do 10-split cross validation
        Instances[][] split = crossValidationSplit(data, 10);

        // Separate split into training and testing arrays
        Instances[] trainingSplits = split[0];
        Instances[] testingSplits = split[1];


        // Use a set of classifiers
        Classifier[] models = {
//              new J48(), // a decision tree
//              new PART(),
//                  new DecisionTable(),//decision table majority classifier
//          new DecisionStump(), //one-level decision tree
                new NaiveBayes(),
//                  new AdaBoostM1()
                new RandomForest()
//                  new LMT()
        };

        // Run for each model
        for (int j = 0; j < models.length; j++)
        {

            // Collect every group of predictions for current model in a FastVector
            FastVector predictions = new FastVector();

            // For each training-testing split pair, train and test the classifier

            for (int i = 0; i < trainingSplits.length; i++)
            {
                Evaluation validation = classify(models[j], trainingSplits[i], testingSplits[i]);

                predictions.appendElements(validation.predictions());
                System.out.println(validation.toMatrixString());
                // Uncomment to see the summary for each training-testing pair.
//              System.out.println(models[j].toString());
                 // generate curve
                ThresholdCurve tc = new ThresholdCurve();
                int classIndex = 0;
                Instances result = tc.getCurve(validation.predictions(), classIndex);
                System.out.println("tPR :"+validation.truePositiveRate(classIndex));
                System.out.println("fNR :"+validation.falseNegativeRate(classIndex));

                // plot curve
                ThresholdVisualizePanel vmc = new ThresholdVisualizePanel();
                vmc.setROCString("(Area under ROC = " +
                    Utils.doubleToString(tc.getROCArea(result), 4) + ")");
                vmc.setName(result.relationName());
                PlotData2D tempd = new PlotData2D(result);
                tempd.setPlotName(result.relationName());
                tempd.addInstanceNumberAttribute();
                // specify which points are connected
                boolean[] cp = new boolean[result.numInstances()];
                for (int n = 1; n < cp.length; n++)
                  cp[n] = true;
                tempd.setConnectPoints(cp);
                // add plot
                vmc.addPlot(tempd);

                // display curve
                String plotName = vmc.getName();
                final javax.swing.JFrame jf =
                  new javax.swing.JFrame("Weka Classifier Visualize: "+plotName);
                jf.setSize(500,400);
                jf.getContentPane().setLayout(new BorderLayout());
                jf.getContentPane().add(vmc, BorderLayout.CENTER);
                jf.addWindowListener(new java.awt.event.WindowAdapter() {
                  public void windowClosing(java.awt.event.WindowEvent e) {
                  jf.dispose();
                  }
                });
                jf.setVisible(true);

            }

            // Calculate overall accuracy of current classifier on all splits
            double accuracy = calculateAccuracy(predictions);

            // Print current classifier's name and accuracy in a complicated,
            // but nice-looking way.
            System.out.println("Accuracy of " + models[j].getClass().getSimpleName() + ": "
                    + String.format("%.2f%%", accuracy)
                    + "\n---------------------------------");


        }


    }
}
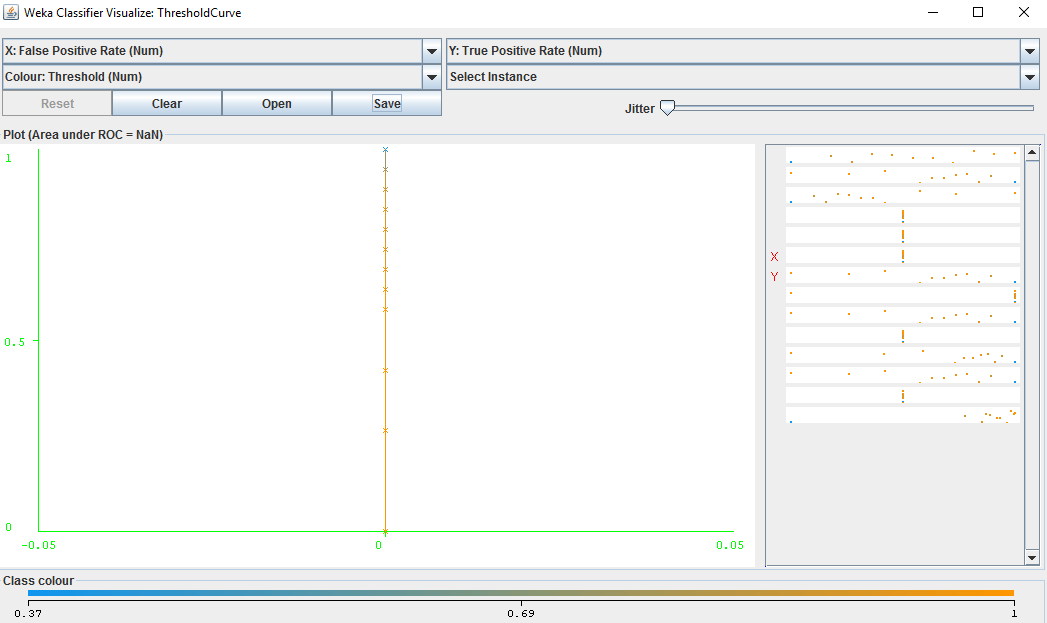
Файл arff содержит описание, за которым следуют 20 атрибутов данных, за которыми следует метка класса "Да" или "Нет". При выполнении этого на некоторых данных TPR и FPR точно рассчитываются и отображаются в соответствии с каждой матрицей путаницы; Однако область под кривой ROC отображается как "NaN", а кривая представляет собой прямую вертикальную или горизонтальную линию: 
Что я делаю неправильно? Любая помощь приветствуется.
1 ответ
Это был бы комментарий, но я новичок и пока не могу комментировать. Я запустил ваш код из цикла, и с моими данными он работает как шарм. Так что это не проблема с печатью.
Похоже, ваша оценка работает
При выполнении этого на некоторых данных TPR и FPR точно рассчитываются и отображаются в соответствии с каждой матрицей путаницы;
Так вы когда-нибудь пробовали следующую функцию класса Evaluation?
evaluation.areaUnderROC(int classIndex);
Чтобы увидеть, как должна выглядеть кривая ROC?
Ваш класс ярлыков {"yes","no"} или {0,1}? Я не думаю, что это проблема, но не могли бы вы попробовать
Instances result = tc.getCurve(validation.predictions());вместо
Instances result = tc.getCurve(validation.predictions(), classIndex);
Можете ли вы опубликовать некоторые значения матрицы путаницы и TPR/FPR.
ура