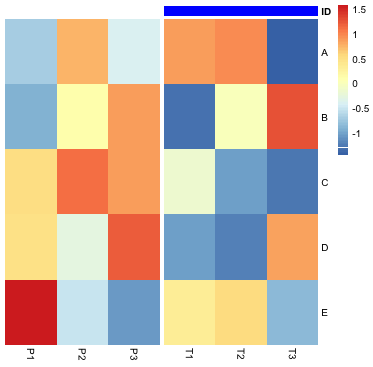
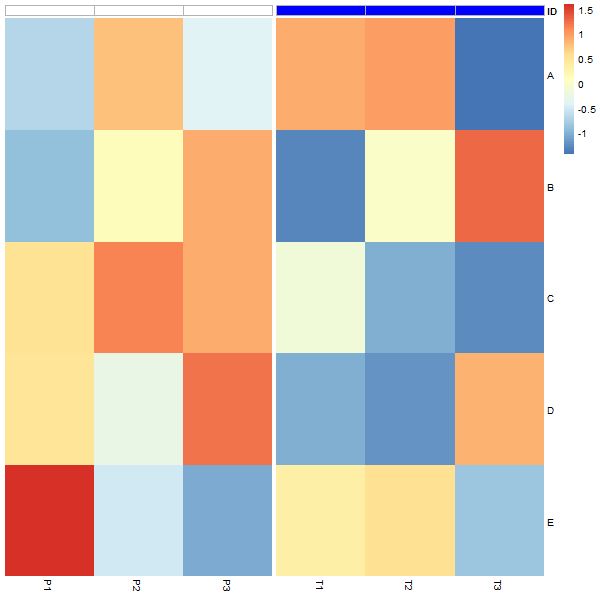
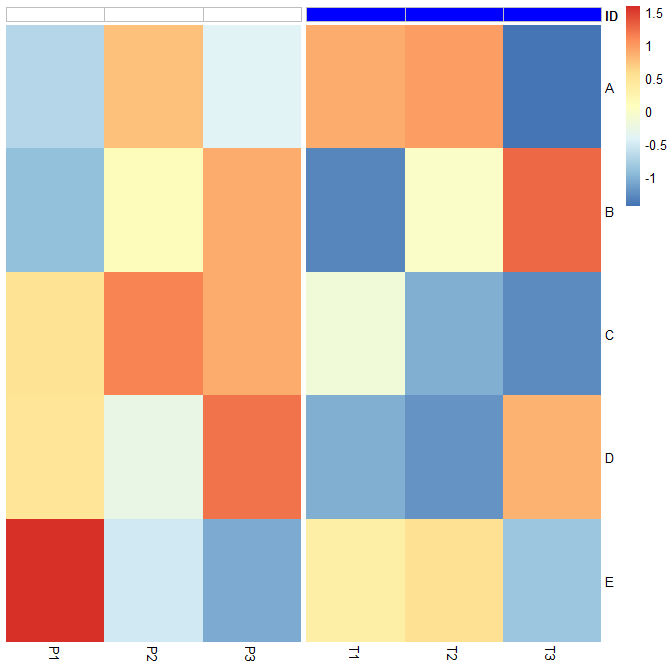
Pheatmap аннотации цвета и границы
Pheatmap library(pheatmap) принимает annotation_colorsдобавить цвета идентификатора заголовка в верхней части каждого столбца тепловой карты.
Я хочу добавить белый цвет заголовка столбца с границами. Границу можно добавить border_color но эта функция рисует границы также для всей тепловой карты.
Ниже то, что я сделал до сих пор.
library(pheatmap)
set.seed(123)
df<-data.frame( matrix(sample(30), ncol = 5))
colnames(df)<-LETTERS[1:5]
subj<-c("P1", "P2","P3", "T1", "T2","T3")
rownames(df)<-subj
aka2 = data.frame(ID = factor(rep(c("Pat","Trea"), each=3)))
rownames(aka2)<-subj
aka3 = list(ID = c(Pat = "white", Trea="blue"))
pheatmap(t(scale(df)),
         annotation_col = aka2,
         annotation_colors = aka3[1],
         annotation_legend = FALSE,
         gaps_col =  3,
         show_colnames = T, show_rownames = T, cluster_rows = F,
         cluster_cols = F, legend = TRUE,
         clustering_distance_rows = "euclidean", border_color = FALSE)
3 ответа
Я использую grid Функции для редактирования соответствующего гроба:
library(pheatmap)
set.seed(123)
df<-data.frame( matrix(sample(30), ncol = 5))
colnames(df)<-LETTERS[1:5]
subj<-c("P1", "P2","P3", "T1", "T2","T3")
rownames(df)<-subj
aka2 = data.frame(ID = factor(rep(c("Pat","Trea"), each=3)))
rownames(aka2)<-subj
aka3 = list(ID = c(Pat = "white", Trea="blue"))

pheatmap(t(scale(df)),
         annotation_col = aka2,
         annotation_colors = aka3[1],
         annotation_legend = FALSE,
         gaps_col =  3,
         show_colnames = T, show_rownames = T, cluster_rows = F,
         cluster_cols = F, legend = TRUE,
         clustering_distance_rows = "euclidean", border_color = FALSE)

# Edit the relevant grob
library(grid)
grid.ls(grid.force()) # "col_annotation" looks like it's the one to edit
grid.gedit("col_annotation", gp = gpar(col="grey70"))
применение grid.gget("col_annotation")$gp к первоначальной тепловой карте показывает, что col_annotation есть gp слот с fill установить, но нет col, После редактирования оба fill а также col установлены.
Я очень старался редактировать grobs добавить цвет рамки только для аннотаций, но я думаю, что единственный способ - это изменить pheatmap функция, а также основной heatmap_motor, Здесь pheatmap2 а также heatmap_motor2 функции. Единственные изменения в том, что pheatmap2 звонки heatmap_motor2 и эта строка border_color="gray" в heatmap_motor2, Вы можете найти это около 2/3 пути в heatmap_motor2,
pheatmap2
pheatmap2 <-function (mat, color = colorRampPalette(rev(brewer.pal(n = 7,
    name = "RdYlBu")))(100), kmeans_k = NA, breaks = NA, border_color = "grey60",
    cellwidth = NA, cellheight = NA, scale = "none", cluster_rows = TRUE,
    cluster_cols = TRUE, clustering_distance_rows = "euclidean",
    clustering_distance_cols = "euclidean", clustering_method = "complete",
    clustering_callback = identity2, cutree_rows = NA, cutree_cols = NA,
    treeheight_row = ifelse(cluster_rows, 50, 0), treeheight_col = ifelse(cluster_cols,
        50, 0), legend = TRUE, legend_breaks = NA, legend_labels = NA,
    annotation_row = NA, annotation_col = NA, annotation = NA,
    annotation_colors = NA, annotation_legend = TRUE, drop_levels = TRUE,
    show_rownames = T, show_colnames = T, main = NA, fontsize = 10,
    fontsize_row = fontsize, fontsize_col = fontsize, display_numbers = F,
    number_format = "%.2f", number_color = "grey30", fontsize_number = 0.8 *
        fontsize, gaps_row = NULL, gaps_col = NULL, labels_row = NULL,
    labels_col = NULL, filename = NA, width = NA, height = NA,
    silent = FALSE, ...)
{
    if (is.null(labels_row)) {
        labels_row = rownames(mat)
    }
    if (is.null(labels_col)) {
        labels_col = colnames(mat)
    }
    mat = as.matrix(mat)
    if (scale != "none") {
        mat = scale_mat(mat, scale)
        if (is.na2(breaks)) {
            breaks = generate_breaks(mat, length(color), center = T)
        }
    }
    if (!is.na(kmeans_k)) {
        km = kmeans(mat, kmeans_k, iter.max = 100)
        mat = km$centers
        t = table(km$cluster)
        labels_row = sprintf("Cluster: %s Size: %d", names(t),
            t)
    }
    else {
        km = NA
    }
    if (is.matrix(display_numbers) | is.data.frame(display_numbers)) {
        if (nrow(display_numbers) != nrow(mat) | ncol(display_numbers) !=
            ncol(mat)) {
            stop("If display_numbers provided as matrix, its dimensions have to match with mat")
        }
        display_numbers = as.matrix(display_numbers)
        fmat = matrix(as.character(display_numbers), nrow = nrow(display_numbers),
            ncol = ncol(display_numbers))
        fmat_draw = TRUE
    }
    else {
        if (display_numbers) {
            fmat = matrix(sprintf(number_format, mat), nrow = nrow(mat),
                ncol = ncol(mat))
            fmat_draw = TRUE
        }
        else {
            fmat = matrix(NA, nrow = nrow(mat), ncol = ncol(mat))
            fmat_draw = FALSE
        }
    }
    if (cluster_rows) {
        tree_row = cluster_mat(mat, distance = clustering_distance_rows,
            method = clustering_method)
        tree_row = clustering_callback(tree_row, mat)
        mat = mat[tree_row$order, , drop = FALSE]
        fmat = fmat[tree_row$order, , drop = FALSE]
        labels_row = labels_row[tree_row$order]
        if (!is.na(cutree_rows)) {
            gaps_row = find_gaps(tree_row, cutree_rows)
        }
        else {
            gaps_row = NULL
        }
    }
    else {
        tree_row = NA
        treeheight_row = 0
    }
    if (cluster_cols) {
        tree_col = cluster_mat(t(mat), distance = clustering_distance_cols,
            method = clustering_method)
        tree_col = clustering_callback(tree_col, t(mat))
        mat = mat[, tree_col$order, drop = FALSE]
        fmat = fmat[, tree_col$order, drop = FALSE]
        labels_col = labels_col[tree_col$order]
        if (!is.na(cutree_cols)) {
            gaps_col = find_gaps(tree_col, cutree_cols)
        }
        else {
            gaps_col = NULL
        }
    }
    else {
        tree_col = NA
        treeheight_col = 0
    }
    attr(fmat, "draw") = fmat_draw
    if (!is.na2(legend_breaks) & !is.na2(legend_labels)) {
        if (length(legend_breaks) != length(legend_labels)) {
            stop("Lengths of legend_breaks and legend_labels must be the same")
        }
    }
    if (is.na2(breaks)) {
        breaks = generate_breaks(as.vector(mat), length(color))
    }
    if (legend & is.na2(legend_breaks)) {
        legend = grid.pretty(range(as.vector(breaks)))
        names(legend) = legend
    }
    else if (legend & !is.na2(legend_breaks)) {
        legend = legend_breaks[legend_breaks >= min(breaks) &
            legend_breaks <= max(breaks)]
        if (!is.na2(legend_labels)) {
            legend_labels = legend_labels[legend_breaks >= min(breaks) &
                legend_breaks <= max(breaks)]
            names(legend) = legend_labels
        }
        else {
            names(legend) = legend
        }
    }
    else {
        legend = NA
    }
    mat = scale_colours(mat, col = color, breaks = breaks)
    if (is.na2(annotation_col) & !is.na2(annotation)) {
        annotation_col = annotation
    }
    if (!is.na2(annotation_col)) {
        annotation_col = annotation_col[colnames(mat), , drop = F]
    }
    if (!is.na2(annotation_row)) {
        annotation_row = annotation_row[rownames(mat), , drop = F]
    }
    annotation = c(annotation_row, annotation_col)
    annotation = annotation[unlist(lapply(annotation, function(x) !is.na2(x)))]
    if (length(annotation) != 0) {
        annotation_colors = generate_annotation_colours(annotation,
            annotation_colors, drop = drop_levels)
    }
    else {
        annotation_colors = NA
    }
    if (!show_rownames) {
        labels_row = NULL
    }
    if (!show_colnames) {
        labels_col = NULL
    }
    gt = heatmap_motor2(mat, border_color = border_color, cellwidth = cellwidth,
        cellheight = cellheight, treeheight_col = treeheight_col,
        treeheight_row = treeheight_row, tree_col = tree_col,
        tree_row = tree_row, filename = filename, width = width,
        height = height, breaks = breaks, color = color, legend = legend,
        annotation_row = annotation_row, annotation_col = annotation_col,
        annotation_colors = annotation_colors, annotation_legend = annotation_legend,
        main = main, fontsize = fontsize, fontsize_row = fontsize_row,
        fontsize_col = fontsize_col, fmat = fmat, fontsize_number = fontsize_number,
        number_color = number_color, gaps_row = gaps_row, gaps_col = gaps_col,
        labels_row = labels_row, labels_col = labels_col, ...)
    if (is.na(filename) & !silent) {
        grid.newpage()
        grid.draw(gt)
    }
    invisible(list(tree_row = tree_row, tree_col = tree_col,
        kmeans = km, gtable = gt))
}
heatmap_motor2
heatmap_motor2 <-function (matrix, border_color, cellwidth, cellheight, tree_col,
    tree_row, treeheight_col, treeheight_row, filename, width,
    height, breaks, color, legend, annotation_row, annotation_col,
    annotation_colors, annotation_legend, main, fontsize, fontsize_row,
    fontsize_col, fmat, fontsize_number, number_color, gaps_col,
    gaps_row, labels_row, labels_col, ...)
{
    lo = lo(coln = labels_col, rown = labels_row, nrow = nrow(matrix),
        ncol = ncol(matrix), cellwidth = cellwidth, cellheight = cellheight,
        treeheight_col = treeheight_col, treeheight_row = treeheight_row,
        legend = legend, annotation_col = annotation_col, annotation_row = annotation_row,
        annotation_colors = annotation_colors, annotation_legend = annotation_legend,
        main = main, fontsize = fontsize, fontsize_row = fontsize_row,
        fontsize_col = fontsize_col, gaps_row = gaps_row, gaps_col = gaps_col,
        ...)
    res = lo$gt
    mindim = lo$mindim
    if (!is.na(filename)) {
        if (is.na(height)) {
            height = convertHeight(gtable_height(res), "inches",
                valueOnly = T)
        }
        if (is.na(width)) {
            width = convertWidth(gtable_width(res), "inches",
                valueOnly = T)
        }
        r = regexpr("\\.[a-zA-Z]*$", filename)
        if (r == -1)
            stop("Improper filename")
        ending = substr(filename, r + 1, r + attr(r, "match.length"))
        f = switch(ending, pdf = function(x, ...) pdf(x, ...),
            png = function(x, ...) png(x, units = "in", res = 300,
                ...), jpeg = function(x, ...) jpeg(x, units = "in",
                res = 300, ...), jpg = function(x, ...) jpeg(x,
                units = "in", res = 300, ...), tiff = function(x,
                ...) tiff(x, units = "in", res = 300, compression = "lzw",
                ...), bmp = function(x, ...) bmp(x, units = "in",
                res = 300, ...), stop("File type should be: pdf, png, bmp, jpg, tiff"))
        f(filename, height = height, width = width)
        gt = heatmap_motor(matrix, cellwidth = cellwidth, cellheight = cellheight,
            border_color = border_color, tree_col = tree_col,
            tree_row = tree_row, treeheight_col = treeheight_col,
            treeheight_row = treeheight_row, breaks = breaks,
            color = color, legend = legend, annotation_col = annotation_col,
            annotation_row = annotation_row, annotation_colors = annotation_colors,
            annotation_legend = annotation_legend, filename = NA,
            main = main, fontsize = fontsize, fontsize_row = fontsize_row,
            fontsize_col = fontsize_col, fmat = fmat, fontsize_number = fontsize_number,
            number_color = number_color, labels_row = labels_row,
            labels_col = labels_col, gaps_col = gaps_col, gaps_row = gaps_row,
            ...)
        grid.draw(gt)
        dev.off()
        return(gt)
    }
    if (mindim < 3)
        border_color = NA
    if (!is.na(main)) {
        elem = draw_main(main, fontsize = 1.3 * fontsize, ...)
        res = gtable_add_grob(res, elem, t = 1, l = 3, name = "main")
    }
    if (!is.na2(tree_col) & treeheight_col != 0) {
        elem = draw_dendrogram(tree_col, gaps_col, horizontal = T)
        res = gtable_add_grob(res, elem, t = 2, l = 3, name = "col_tree")
    }
    if (!is.na2(tree_row) & treeheight_row != 0) {
        elem = draw_dendrogram(tree_row, gaps_row, horizontal = F)
        res = gtable_add_grob(res, elem, t = 4, l = 1, name = "row_tree")
    }
    elem = draw_matrix(matrix, border_color, gaps_row, gaps_col,
        fmat, fontsize_number, number_color)
    res = gtable_add_grob(res, elem, t = 4, l = 3, clip = "off",
        name = "matrix")
    if (length(labels_col) != 0) {
        pars = list(labels_col, gaps = gaps_col, fontsize = fontsize_col,
            ...)
        elem = do.call(draw_colnames, pars)
        res = gtable_add_grob(res, elem, t = 5, l = 3, clip = "off",
            name = "col_names")
    }
    if (length(labels_row) != 0) {
        pars = list(labels_row, gaps = gaps_row, fontsize = fontsize_row,
            ...)
        elem = do.call(draw_rownames, pars)
        res = gtable_add_grob(res, elem, t = 4, l = 4, clip = "off",
            name = "row_names")
    }
    if (!is.na2(annotation_col)) {
        converted_annotation = convert_annotations(annotation_col,
            annotation_colors)
        elem = draw_annotations(converted_annotation, border_color="gray", #Modified here
            gaps_col, fontsize, horizontal = T)
        res = gtable_add_grob(res, elem, t = 3, l = 3, clip = "off",
            name = "col_annotation")
        elem = draw_annotation_names(annotation_col, fontsize,
            horizontal = T)
        res = gtable_add_grob(res, elem, t = 3, l = 4, clip = "off",
            name = "row_annotation_names")
    }
    if (!is.na2(annotation_row)) {
        converted_annotation = convert_annotations(annotation_row,
            annotation_colors)
        elem = draw_annotations(converted_annotation, border_color,
            gaps_row, fontsize, horizontal = F)
        res = gtable_add_grob(res, elem, t = 4, l = 2, clip = "off",
            name = "row_annotation")
        if (length(labels_col) != 0) {
            elem = draw_annotation_names(annotation_row, fontsize,
                horizontal = F)
            res = gtable_add_grob(res, elem, t = 5, l = 2, clip = "off",
                name = "row_annotation_names")
        }
    }
    annotation = c(annotation_col[length(annotation_col):1],
        annotation_row[length(annotation_row):1])
    annotation = annotation[unlist(lapply(annotation, function(x) !is.na2(x)))]
    if (length(annotation) > 0 & annotation_legend) {
        elem = draw_annotation_legend(annotation, annotation_colors,
            border_color, fontsize = fontsize, ...)
        t = ifelse(is.null(labels_row), 4, 3)
        res = gtable_add_grob(res, elem, t = t, l = 6, b = 5,
            clip = "off", name = "annotation_legend")
    }
    if (!is.na2(legend)) {
        elem = draw_legend(color, breaks, legend, fontsize = fontsize,
            ...)
        t = ifelse(is.null(labels_row), 4, 3)
        res = gtable_add_grob(res, elem, t = t, l = 5, b = 5,
            clip = "off", name = "legend")
    }
    return(res)
}
Затем важно добавить эти две новые функции в pheatmap среда. pheatmap использует функции, которые можно найти только в его собственной среде.
environment(pheatmap2) <- asNamespace('pheatmap')
environment(heatmap_motor2) <- asNamespace('pheatmap')
С серыми границами для аннотаций, использующих pheatmap2:
library(pheatmap)
set.seed(123)
df<-data.frame( matrix(sample(30), ncol = 5))
colnames(df)<-LETTERS[1:5]
subj<-c("P1", "P2","P3", "T1", "T2","T3")
rownames(df)<-subj
aka2 = data.frame(ID = factor(rep(c("Pat","Trea"), each=3)))
rownames(aka2)<-subj
aka3 = list(ID = c(Pat = "white", Trea="blue"))
pheatmap2(t(scale(df)),
         annotation_col = aka2,
         annotation_colors = aka3[1], #aka3[1]
         annotation_legend = FALSE,
         gaps_col =  3,
         show_colnames = T, show_rownames = T, cluster_rows = F,
         cluster_cols = F, legend = TRUE,
         clustering_distance_rows = "euclidean", border_color = FALSE)
Pheatmap annotation_col/annotation_row и границы и annotation_colors
Просто, чтобы сделать несколько комментариев, которые могут быть немного не по теме здесь, но актуальны в контексте этого вопроса и могут спасти кого-то некоторые проблемы.
Если вас интересует наличие границ для всех ячеек в тепловой карте после установки annotation_col или annotation_row, вы должны явно указать cellheight и cellcellight выше определенных уровней (я использовал cellwidth = 3, cellheight=12).
Синтаксис для annotation_color несколько сложен и требует списка именованных векторов с именованными компонентами. Например:
annotation_col = data.frame("Cell_of_Origin"=factor(dta.disc$cell.origin,exclude=NULL,labels=c("GCB","non_GCB","Unclassifiable")))
rownames(annotation_col)=dta.disc$id
annotation_colors = list(Cell_of_Origin=c(GCB="red",non_GCB="green",Unclassifiable="yellow"))[1]
Где Cell_of_Origin - моя переменная annotation_col, а GCB,non_GCB, Unclassifiable - это уровни фактора.
Мне кажется странным добавлять сетку для аннотированных классов, а не сетку для кластеров (то есть подклассы могут быть "странно" распределены внутри кластеров). Один из вариантов, с которым я играл, состоял в том, чтобы сгенерировать дендрограмму для каждого подкласса отдельно, а затем объединить дендрограммы вместе. В таком случае вы можете добавить промежутки между кластерами, используя опции cutree_cols / cutree_row. Результаты были не очень хорошими, но это может быть направление для изучения.
dend_gcb = reorder(as.dendrogram(hclust(dist(as.matrix(t(dta.disc[dta.disc$cell.origin=="gcb",vars_reduced]))))),agglo.FUN=mean)
dend_ngcb = reorder(as.dendrogram(hclust(dist(as.matrix(t(dta.disc[dta.disc$cell.origin=="non-gcb",vars_reduced]))))),agglo.FUN=mean)
dend_uncls =reorder(as.dendrogram(hclust(dist(as.matrix(t(dta.disc[is.na(dta.disc$cell.origin),vars_reduced]))))),agglo.FUN=mean)
dend=merge(merge(dend_gcb,dend_ngcb),dend_uncls)


