iOS CorePlot конвертация точек
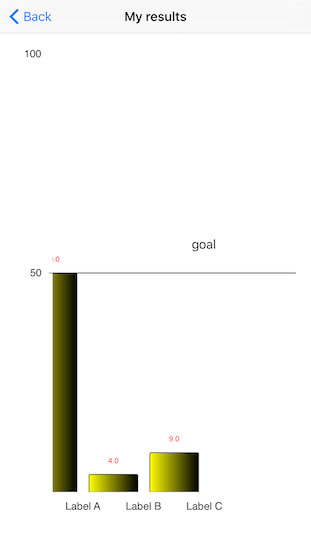
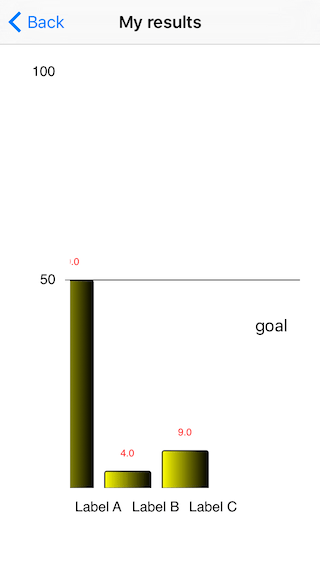
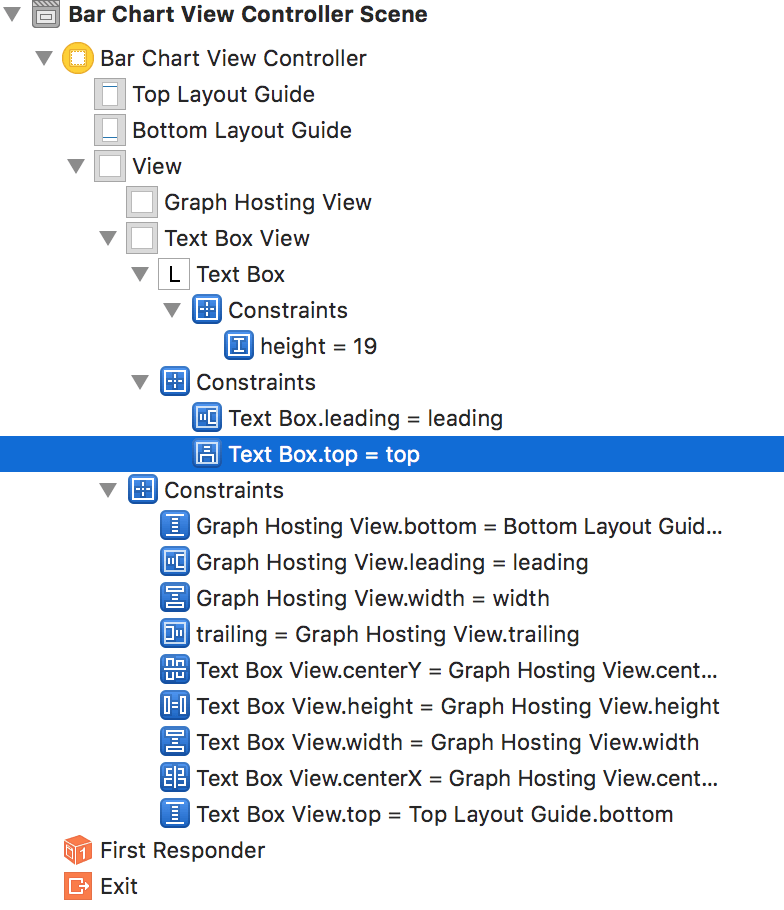
Я экспериментирую с Core Plot. Я пытаюсь добавить пользовательскую метку "цели" на графике в x: 2.0, y: 50.0 - в основном метка над y == 50, в отдельном представлении, что означает, что мне нужно преобразовать свою точку из основного графика в мой UIView границы. Я не нашел комбинацию преобразований точек из слоя / представлений, которая бы работала на всех размерах экрана iPhone. На моих картинках ниже iPhone 6s самый близкий.
Вот мой класс:
class BarChartViewController: UIViewController, CPTBarPlotDataSource
{
    private var barGraph : CPTXYGraph? = nil
    @IBOutlet weak var textBox: UILabel!
    @IBOutlet weak var graphHostingView: CPTGraphHostingView!
    @IBOutlet weak var textBoxView: UIView!

    override func viewDidLoad() {
        super.viewDidLoad()

        self.navigationController?.setNavigationBarHidden(false, animated: false)

        self.title = "My results"

        let newGraph = CPTXYGraph(frame: CGRectZero)
        let theme = CPTTheme(named: kCPTPlainWhiteTheme)

        newGraph.applyTheme(theme)

        let hostingView = graphHostingView
        hostingView.hostedGraph = newGraph
        if let frameLayer = newGraph.plotAreaFrame
        {
            // Border
            frameLayer.borderLineStyle = nil
            frameLayer.cornerRadius = 0.0
            frameLayer.masksToBorder = false

            // Paddings
            newGraph.paddingLeft = 0.0
            newGraph.paddingRight = 0.0
            newGraph.paddingTop = 0.0
            newGraph.paddingBottom = 0.0

            frameLayer.paddingLeft = 70.0
            frameLayer.paddingTop = 20.0
            frameLayer.paddingRight = 20.0
            frameLayer.paddingBottom = 80.0
        }

        // Plot space
        let plotSpace = newGraph.defaultPlotSpace as? CPTXYPlotSpace
        plotSpace?.yRange = CPTPlotRange(location: 0.0, length: 100.0)
        plotSpace?.xRange = CPTPlotRange(location: 0.0, length: 4.0)

        let axisSet = newGraph.axisSet as? CPTXYAxisSet

        if let x = axisSet?.xAxis {
            x.axisLineStyle = nil
            x.majorTickLineStyle = nil
            x.minorTickLineStyle = nil
            x.majorIntervalLength = 5.0
            x.orthogonalPosition = 0.0
            x.title = "X Axis"
            x.titleLocation = 7.5
            x.titleOffset = 55.0

            // Custom labels
            x.labelRotation = CGFloat(M_PI_4)
            x.labelingPolicy = .None

            let customTickLocations = [0.5, 1.5, 2.5]
            let xAxisLabels = ["Label A", "Label B", "Label C"]

            var labelLocation = 0
            var customLabels = Set<CPTAxisLabel>()
            for tickLocation in customTickLocations
            {
                let newLabel = CPTAxisLabel(text: xAxisLabels[labelLocation], textStyle: x.labelTextStyle)
                labelLocation += 1
                newLabel.tickLocation = tickLocation
                newLabel.offset = x.labelOffset + x.majorTickLength
                newLabel.rotation = 0 //CGFloat(M_PI_4)
                customLabels.insert(newLabel)
            }

            x.axisLabels = customLabels
        }

        if let y = axisSet?.yAxis
        {
            y.axisLineStyle = nil
            y.majorGridLineStyle = CPTMutableLineStyle()
            var style = y.majorTickLineStyle?.mutableCopy() as? CPTMutableLineStyle
            //style!.lineColor = CPTColor(CGColor: UIColor.blackColor())   //UIColor.blackColor())
            style!.lineWidth = 10.0
            y.minorGridLineStyle = CPTMutableLineStyle()
            style = y.minorTickLineStyle?.mutableCopy() as? CPTMutableLineStyle
            //style.lineColor = UIColor.redColor()
            style!.lineWidth = 10.0
            style!.lineCap = .Round
            y.majorTickLength = 10.0
            y.majorIntervalLength = 50.0
            y.orthogonalPosition = 0.0
            y.title = "Y Axis"
            y.titleOffset = 45.0
            y.titleLocation = 150.0

            y.labelRotation = 0
            y.labelingPolicy = .None


            let customTickLocations = [50, 100]
            let yAxisLabels = ["50", "100"]

            var labelLocation = 0
            var customLabels = Set<CPTAxisLabel>()
            for tickLocation in customTickLocations
            {
                let newLabel = CPTAxisLabel(text: yAxisLabels[labelLocation], textStyle: y.labelTextStyle)
                labelLocation += 1
                newLabel.tickLocation = tickLocation
                newLabel.offset = y.labelOffset + y.majorTickLength
                newLabel.rotation = 0 //CGFloat(M_PI_4)
                customLabels.insert(newLabel)
            }

            y.axisLabels = customLabels
            var nums = Set<NSNumber>()
            nums.insert(NSNumber(double: 50.0))
            y.majorTickLocations = nums
        }

        // First bar plot
        let barPlot1 = CPTBarPlot.tubularBarPlotWithColor(CPTColor.yellowColor(), horizontalBars: false)
        barPlot1.baseValue = 0.0
        barPlot1.dataSource = self
        //barPlot1.barOffset = 0.5
        barPlot1.identifier = "Bar Plot 1"
        let textStyle = CPTMutableTextStyle()
        textStyle.color = CPTColor.redColor()
        textStyle.fontSize = 10.0
        barPlot1.labelTextStyle = textStyle
        newGraph.addPlot(barPlot1, toPlotSpace: plotSpace)

        self.barGraph = newGraph
    }

    override func viewWillAppear(animated: Bool) {
        super.viewWillAppear(animated)

        self.view.layoutIfNeeded()

        let point: [Double] = [2.0, 50.0]
        let plotPoint = UnsafeMutablePointer<Double>(point)
        var dataPoint = self.barGraph?.defaultPlotSpace?.plotAreaViewPointForDoublePrecisionPlotPoint(plotPoint, numberOfCoordinates: 2)
        //dataPoint = graphHostingView.layer.convertPoint(dataPoint!, fromLayer: self.barGraph!.plotAreaFrame!.plotArea)
        dataPoint = graphHostingView.layer.convertPoint(dataPoint!, toLayer: graphHostingView.layer.superlayer)
        //dataPoint = barGraph?.convertPoint(dataPoint!, fromLayer: graphHostingView.layer)
        dataPoint = self.textBoxView.convertPoint(dataPoint!, fromView: graphHostingView)

        print(dataPoint!)
        for item in (self.textBoxView?.constraints)!
        {
            if let id = item.identifier
            {
                if id == "goalX"
                {
                    print(item.constant)
                    item.constant = CGFloat((dataPoint?.x)!) - item.constant
                }
                else if id == "goalY"
                {
                    print(item.constant)
                    item.constant = CGFloat((dataPoint?.y)!) - item.constant
                }
            }
        }
        barGraph?.titleDisplacement = CGPoint(x: dataPoint!.x * -1, y: dataPoint!.y * -1)
        barGraph?.titlePlotAreaFrameAnchor = .TopLeft
        self.textBoxView?.layoutIfNeeded()
   }
}
Основываясь на некоторых других вопросах, которые я видел о CorePlot, я знаю, что мне нужно преобразовать его из слоя CorePlot в мой новый вид. Я оставил некоторые из моих экспериментов в viewWillAppear(), чтобы увидеть, что я попробовал. Казалось, что ни одно из решений для SO не сработало, и я новичок в iOS, поэтому, возможно, что-то упустил. Любые идеи о том, какие преобразования мне нужно сделать, чтобы мой ярлык правильно отображался на всех экранах?
1 ответ
Вы на правильном пути с точки конверсии. Вот как я бы это сделал:
// Update layer layout if needed
self.view.layoutIfNeeded()
graphHostingView.layer.layoutIfNeeded()

// Point in data coordinates
let point: [Double] = [2.0, 50.0]

// Data point in plot area layer coordinates
var dataPoint = self.barGraph?.defaultPlotSpace?.plotAreaViewPointForPlotPoint(point)

// Convert data point to graph hosting view coordinates
dataPoint = graphHostingView.layer.convertPoint(dataPoint!, fromLayer: self.barGraph!.plotAreaFrame!.plotArea)
Используйте это, чтобы обновить ограничения на текстовое поле относительно представления размещения графа.


