Как я могу масштабировать время (часы) моей оси x в ggplot2 в r?
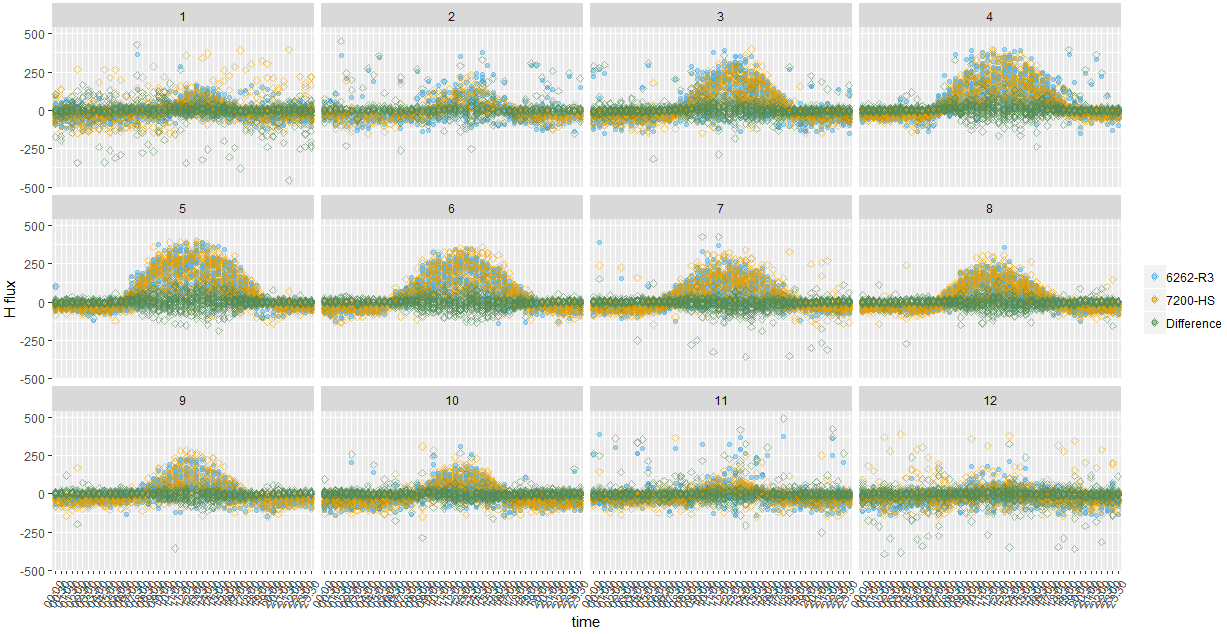
Я создал ggplot с ggplot2. Сюжет представляет собой серию измерений за год, и я организовал это по месяцам. Это мой код:
ggplot(data = mydataframe, aes(x = time)) +
  geom_point(aes(y = H_flux_6262_R3,  color = "6262-R3"),
             alpha = 0.5,
             shape = 19) +
  geom_point(aes(y = H_flux_7200_HS,  color = "7200-HS"),
             alpha = 0.5,
             shape = 5) +
  geom_point(
    aes(y = H_flux_dif_6262_R3_7200_HS,  color = "Difference"),
    alpha = 0.5,
    shape = 5
  ) +
  facet_wrap( ~ Month, nrow = 3) +
  theme(text = element_text(),
        axis.text.x = element_text(angle = 60, hjust = 1)) +
  theme(legend.position = "right", legend.title = element_blank()) +
  scale_color_manual(values = c("#56B4E9", "#E69F00", "palegreen4")) +
  labs(x = "time", y = "H flux")
Формат моего времени: %H:%M:%S, например, 00:00:00.
H flux 6262_R3 H_flux_7200_HS Time
 100             500         02:00:00
 400             700         02:30:00
 400             700         03:00:00
 400             700         03:30:00
 400             700         04:00:00
 100             500         04:30:00
 400             700         05:00:00
 400             700         05:30:00
 400             700         06:30:00
 400             700         07:00:00
и так до 00:00:00. У меня есть измерения моих данных каждые 30 минут. Когда я строю график, у меня возникает проблема, что он не масштабируется, например, каждые 4 часа, без секунд, поскольку они мне не нужны. Я пробовал это с очень многими различными методами, и это только не будет работать. Я в отчаянии, извините. Мэйби, кто-нибудь может мне помочь? Я бы оценил это!
1 ответ
Вы почти там. Вы можете немного изменить свой код, чтобы получить желаемый результат. Необходимые модификации:
1.Convert `Time` column to `POSIXct` type
2.The `facet_wrap` should use month part of `Time` column. Hence it can be written as:
          facet_wrap(~format(Time,"%m"), scales = "free")
3.Use of `scale_x_datetime` to format x-axis to write label every 4 hours can be as:
          scale_x_datetime(date_breaks = "4 hours", date_labels = "%Y-%m-%d %H:%M")
Решение:
#First prepare the data to have Time column of type POSIXct and diff column
mydataframe$Time = as.POSIXct(mydataframe$Time, format = "%m-%d-%Y %H:%M:%S")
mydataframe$H_flux_dif_6262_R3_7200_HS <- mydataframe$H_flux_7200_HS -
                                                   mydataframe$H_flux_6262_R3


library(ggplot2)
ggplot(data = mydataframe, aes(x = Time)) +
  geom_point(aes(y = H_flux_6262_R3,  color = "6262-R3"),
             alpha = 0.5,
             shape = 19) +
  geom_point(aes(y = H_flux_7200_HS,  color = "7200-HS"),
             alpha = 0.5,
             shape = 5) +
  geom_point(
    aes(y = H_flux_dif_6262_R3_7200_HS,  color = "Difference"),
    alpha = 0.5,
    shape = 5
  ) +
  facet_wrap(~format(Time,"%m"), scales = "free") +
  scale_x_datetime(date_breaks = "4 hours", date_labels = "%Y-%m-%d %H:%M")+
  theme(text = element_text(),
        axis.text.x = element_text(angle = 60, hjust = 1)) +
  theme(legend.position = "right", legend.title = element_blank()) +
  scale_color_manual(values = c("#56B4E9", "#E69F00", "palegreen4")) +
  labs(x = "time", y = "H flux")
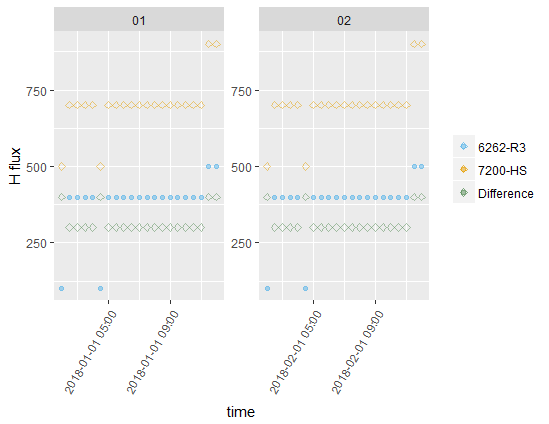
Выход:
Данные: данные находятся в той же строке, что и ОП. Я продлил его на 2 месяца. Также для включения даты в часть времени.
mydataframe <- read.table(text =
"H_flux_6262_R3 H_flux_7200_HS Time
100             500         '01-01-2018 02:00:00'
400             700         '01-01-2018 02:30:00'
400             700         '01-01-2018 03:00:00'
400             700         '01-01-2018 03:30:00'
400             700         '01-01-2018 04:00:00'
100             500         '01-01-2018 04:30:00'
400             700         '01-01-2018 05:00:00'
400             700         '01-01-2018 05:30:00'
400             700         '01-01-2018 06:00:00'
400             700         '01-01-2018 06:30:00'
400             700         '01-01-2018 07:00:00'
400             700         '01-01-2018 07:30:00'
400             700         '01-01-2018 08:00:00'
400             700         '01-01-2018 08:30:00'
400             700         '01-01-2018 09:00:00'
400             700         '01-01-2018 09:30:00'
400             700         '01-01-2018 10:00:00'
400             700         '01-01-2018 10:30:00'
400             700         '01-01-2018 11:00:00'
500             900         '01-01-2018 11:30:00'
500             900         '01-01-2018 12:00:00'
100             500         '02-01-2018 02:00:00'
400             700         '02-01-2018 02:30:00'
400             700         '02-01-2018 03:00:00'
400             700         '02-01-2018 03:30:00'
400             700         '02-01-2018 04:00:00'
100             500         '02-01-2018 04:30:00'
400             700         '02-01-2018 05:00:00'
400             700         '02-01-2018 05:30:00'
400             700         '02-01-2018 06:00:00'
400             700         '02-01-2018 06:30:00'
400             700         '02-01-2018 07:00:00'
400             700         '02-01-2018 07:30:00'
400             700         '02-01-2018 08:00:00'
400             700         '02-01-2018 08:30:00'
400             700         '02-01-2018 09:00:00'
400             700         '02-01-2018 09:30:00'
400             700         '02-01-2018 10:00:00'
400             700         '02-01-2018 10:30:00'
400             700         '02-01-2018 11:00:00'
500             900         '02-01-2018 11:30:00'
500             900         '02-01-2018 12:00:00'",
header = TRUE, stringsAsFactors = FALSE)

