Как определить пределы оси фасета в функции ggpairs
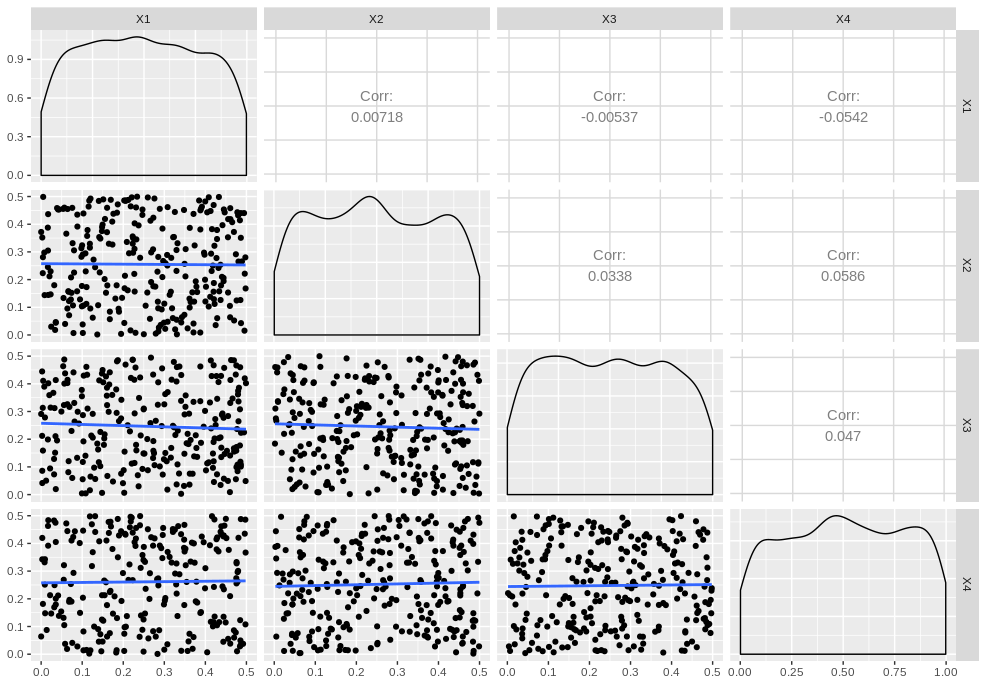
Иметь ggpairs функция, как можно ограничить диапазон нижних граней, например, 0,5 для х и у?
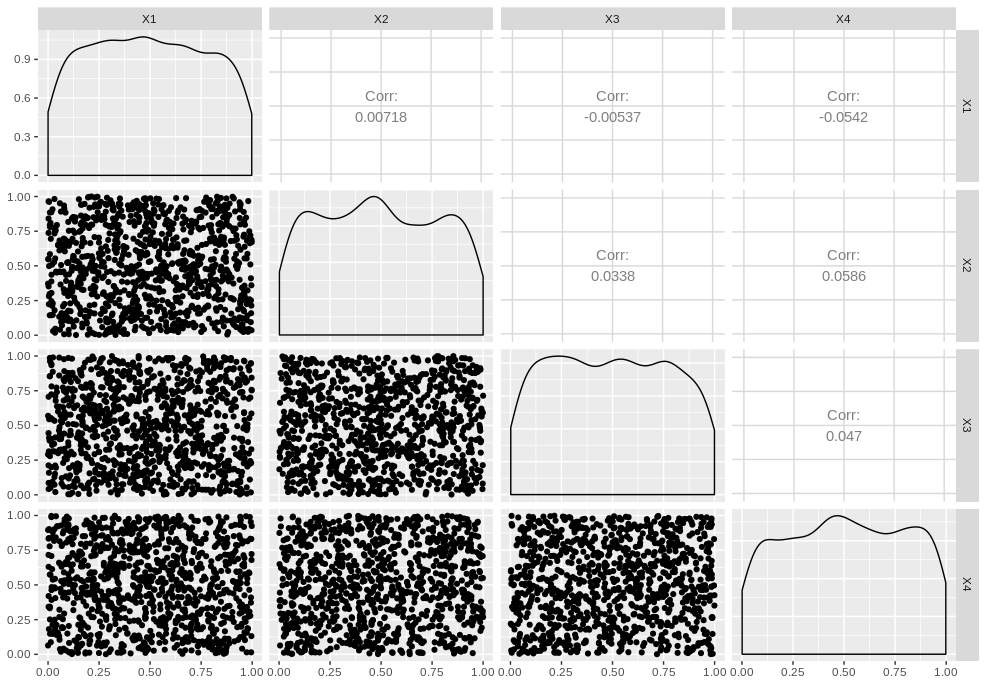
library(GGally)

xy <- data.frame(matrix(runif(4 * 1000), ncol = 4))

ggpairs(xy)
1 ответ
Вы должны определить функцию, которая строит график (один аспект). Вы можете сойти с ума с ggplot здесь. Смотрите этот похожий вопрос.
limitRange <- function(data, mapping, ...) {
  ggplot(data = data, mapping = mapping, ...) +
    geom_point(...) +
    geom_smooth(method = "lm", se = FALSE) +
    scale_y_continuous(limits = c(0, 0.5)) +
    scale_x_continuous(limits = c(0, 0.5))
}

# This is how you specify which part of the image will be
# plotted using your function.
ggpairs(xy, lower = list(continuous = limitRange))