Добавьте плотность или рамку на полях графика в Matplotlib
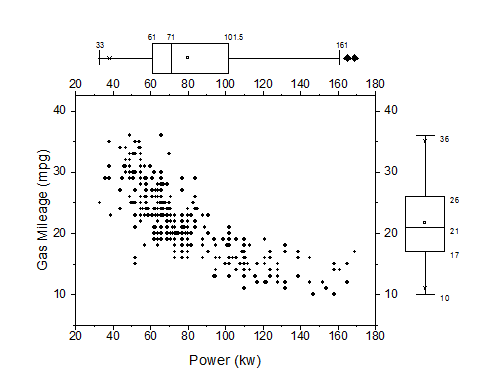
У меня есть точечная диаграмма в линейном масштабе. Я хочу добавить рамочный график к полям (слева и снизу) моего точечного графика, как эта фигура из маргинальных гистограмм и коробочных диаграмм?
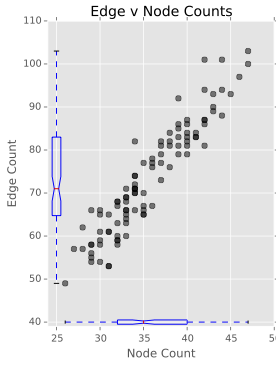
Обновление Вот мое текущее рабочее решение, поделитесь своими мыслями по нему или сделайте лучшее предложение.
ax.plot(df['vcnt'],  df['ecnt'], 'ko', alpha=0.5)
# Save the default tick positions, so we can reset them..

tcksx = ax.get_xticks()
tcksy = ax.get_yticks()

ax.boxplot(df['ecnt'], positions=[min(tcksx)], notch=True, widths=1.)
ax.boxplot(df['vcnt'], positions=[min(tcksy)], vert=False, notch=True, widths=1.)

ax.set_yticks(tcksy) # pos = tcksy
ax.set_xticks(tcksx) # pos = tcksx
ax.set_yticklabels([int(j) for j in tcksy])
ax.set_xticklabels([int(j) for j in tcksx])
ax.set_ylim([min(tcksy-1),max(tcksy)])
ax.set_xlim([min(tcksx-1),max(tcksx)])
1 ответ
Решение
Вы можете добиться этого, создавая дополнительные axes для барных участков.
import pandas as pd
from matplotlib import pyplot as plt
import numpy as np

x_data = np.random.randn(100)
y_data = -x_data + np.random.randn(100)*0.5

df = pd.DataFrame()
df['vcnt'] = x_data
df['ecnt'] = y_data


left = 0.1
bottom = 0.1
top = 0.8
right = 0.8
main_ax = plt.axes([left,bottom,right-left,top-bottom])
# create axes to the top and right of the main axes and hide them
top_ax = plt.axes([left,top,right - left,1-top])
plt.axis('off')
right_ax = plt.axes([right,bottom,1-right,top-bottom])
plt.axis('off')
main_ax.plot(df['vcnt'],  df['ecnt'], 'ko', alpha=0.5)
# Save the default tick positions, so we can reset them..

tcksx = main_ax.get_xticks()
tcksy = main_ax.get_yticks()

right_ax.boxplot(df['ecnt'], positions=[0], notch=True, widths=1.)
top_ax.boxplot(df['vcnt'], positions=[0], vert=False, notch=True, widths=1.)

main_ax.set_yticks(tcksy) # pos = tcksy
main_ax.set_xticks(tcksx) # pos = tcksx
main_ax.set_yticklabels([int(j) for j in tcksy])
main_ax.set_xticklabels([int(j) for j in tcksx])
main_ax.set_ylim([min(tcksy-1),max(tcksy)])
main_ax.set_xlim([min(tcksx-1),max(tcksx)])

# set the limits to the box axes
top_ax.set_xlim(main_ax.get_xlim())
top_ax.set_ylim(-1,1)
right_ax.set_ylim(main_ax.get_ylim())
right_ax.set_xlim(-1,1)


plt.show()

