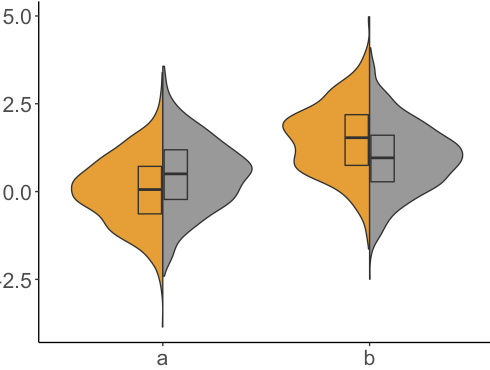
ggplot разбивает сюжет скрипки с горизонтальными средними линиями
Я создал эти раздельные половинки скрипичных сюжетов, используя ggplot. Тем не менее, вместо того, чтобы включить коробочную диаграмму, которая показывает медиану, я бы хотел включить горизонтальную линию со средним значением. Это означает, что каждая цветная половина будет иметь свою собственную среднюю линию: золотая половина будет иметь среднюю линию, которая не будет точно совпадать со средней линией на серой половине. Важно отметить, что средняя линия должна находиться только внутри графика плотности. Как мне этого добиться? Я не могу понять это, и я был бы признателен за любую помощь!
Вот некоторые примеры данных:
set.seed(20160229)

my_data = data.frame(
  y=c(rnorm(1000), rnorm(1000, 0.5), rnorm(1000, 1), rnorm(1000,
1.5)),
  x=c(rep('a', 2000), rep('b', 2000)),
  m=c(rep('i', 1000), rep('j', 2000), rep('i', 1000))
)
Вот расширение для geom_violin для создания split_geom_violin:
GeomSplitViolin <- ggproto("GeomSplitViolin", GeomViolin, draw_group = function(self, data, ..., draw_quantiles = NULL){
  data <- transform(data, xminv = x - violinwidth * (x - xmin), xmaxv = x + violinwidth * (xmax - x))
  grp <- data[1,'group']
  newdata <- plyr::arrange(transform(data, x = if(grp%%2==1) xminv else xmaxv), if(grp%%2==1) y else -y)
  newdata <- rbind(newdata[1, ], newdata, newdata[nrow(newdata), ], newdata[1, ])
  newdata[c(1,nrow(newdata)-1,nrow(newdata)), 'x'] <- round(newdata[1, 'x'])
  if (length(draw_quantiles) > 0 & !scales::zero_range(range(data$y))) {
    stopifnot(all(draw_quantiles >= 0), all(draw_quantiles <=
                                              1))
    quantiles <- ggplot2:::create_quantile_segment_frame(data, draw_quantiles)
    aesthetics <- data[rep(1, nrow(quantiles)), setdiff(names(data), c("x", "y")), drop = FALSE]
    aesthetics$alpha <- rep(1, nrow(quantiles))
    both <- cbind(quantiles, aesthetics)
    quantile_grob <- GeomPath$draw_panel(both, ...)
    ggplot2:::ggname("geom_split_violin", grid::grobTree(GeomPolygon$draw_panel(newdata, ...), quantile_grob))
  }
  else {
    ggplot2:::ggname("geom_split_violin", GeomPolygon$draw_panel(newdata, ...))
  }
})

geom_split_violin <- function (mapping = NULL, data = NULL, stat = "ydensity", position = "identity", ..., draw_quantiles = NULL, trim = TRUE, scale = "area", na.rm = FALSE, show.legend = NA, inherit.aes = TRUE) {
  layer(data = data, mapping = mapping, stat = stat, geom = GeomSplitViolin, position = position, show.legend = show.legend, inherit.aes = inherit.aes, params = list(trim = trim, scale = scale, draw_quantiles = draw_quantiles, na.rm = na.rm, ...))
}
Вот код для графика:
library(ggplot2)
ggplot(my_data, aes(x, y, fill=m)) +
  geom_split_violin(trim = TRUE) +
  geom_boxplot(width = 0.25, notch = FALSE, notchwidth = .4, outlier.shape = NA, coef=0) +
  labs(x=NULL,y="GM Attitude Score") +
  theme_classic() +
  theme(text = element_text(size = 20)) +
  scale_x_discrete(labels=c("0" = "Control\nCondition", "1" = "GM\nCondition")) +
  scale_fill_manual(values=c("#E69F00", "#999999"),
                    name="Survey\nPart",
                    breaks=c("1", "2"),
                    labels=c("Time 1", "Time 5"))
1 ответ
Ты можешь использовать stat_summary & geom_crossbar при настройке всех fun.y, fun.ymin & fun.ymax в mean только
library(ggplot2)

ggplot(my_data, aes(x, y, fill = m)) +
  geom_split_violin(trim = TRUE) +
  stat_summary(fun.y = mean, fun.ymin = mean, fun.ymax = mean,
               geom = "crossbar",
               width = 0.25,
               position = position_dodge(width = .25),
  ) +
  labs(x = NULL, y = "GM Attitude Score") +
  theme_classic() +
  theme(text = element_text(size = 20)) +
  scale_x_discrete(labels = c("0" = "Control\nCondition", "1" = "GM\nCondition")) +
  scale_fill_manual(
    values = c("#E69F00", "#999999"),
    name = "Survey\nPart",
    breaks = c("1", "2"),
    labels = c("Time 1", "Time 5")
  )

Используемые данные и функции:
set.seed(20160229)

my_data <- data.frame(
  y = c(rnorm(1000), rnorm(1000, 0.5), rnorm(1000, 1), rnorm(1000, 1.5)),
  x = c(rep("a", 2000), rep("b", 2000)),
  m = c(rep("i", 1000), rep("j", 2000), rep("i", 1000))
)

GeomSplitViolin <- ggproto(
  "GeomSplitViolin",
  GeomViolin,
  draw_group = function(self, data, ..., draw_quantiles = NULL) {
    data <- transform(data,
                      xminv = x - violinwidth * (x - xmin),
                      xmaxv = x + violinwidth * (xmax - x)
    )
    grp <- data[1, "group"]
    newdata <- plyr::arrange(
      transform(data, x = if (grp %% 2 == 1) xminv else xmaxv),
      if (grp %% 2 == 1) y else -y
    )
    newdata <- rbind(newdata[1, ], newdata, newdata[nrow(newdata), ], newdata[1, ])
    newdata[c(1, nrow(newdata) - 1, nrow(newdata)), "x"] <- round(newdata[1, "x"])
    if (length(draw_quantiles) > 0 & !scales::zero_range(range(data$y))) {
      stopifnot(all(draw_quantiles >= 0), all(draw_quantiles <= 1))
      quantiles <- ggplot2:::create_quantile_segment_frame(data, draw_quantiles)
      aesthetics <- data[rep(1, nrow(quantiles)), setdiff(names(data), c("x", "y")), drop = FALSE]
      aesthetics$alpha <- rep(1, nrow(quantiles))
      both <- cbind(quantiles, aesthetics)
      quantile_grob <- GeomPath$draw_panel(both, ...)
      ggplot2:::ggname(
        "geom_split_violin",
        grid::grobTree(GeomPolygon$draw_panel(newdata, ...), quantile_grob)
      )
    } else {
      ggplot2:::ggname("geom_split_violin", GeomPolygon$draw_panel(newdata, ...))
    }
  }
)

geom_split_violin <- function(mapping = NULL,
                              data = NULL,
                              stat = "ydensity",
                              position = "identity", ...,
                              draw_quantiles = NULL,
                              trim = TRUE,
                              scale = "area",
                              na.rm = FALSE,
                              show.legend = NA,
                              inherit.aes = TRUE) {
  layer(
    data = data,
    mapping = mapping,
    stat = stat,
    geom = GeomSplitViolin,
    position = position,
    show.legend = show.legend,
    inherit.aes = inherit.aes,
    params = list(
      trim = trim,
      scale = scale,
      draw_quantiles = draw_quantiles,
      na.rm = na.rm, ...
    )
  )
}
Создано 2018-07-08 пакетом представлением (v0.2.0.9000).
