Добавление меток к графику с помощью ggplot2 в R
Я получил ошибку, когда я использовал geom_text_repel добавить ярлыки к моему сюжету. Вот коды перед добавлением любых текстовых меток и все работало нормально:
[Вход]
library(ggplot2)
library(ggrepel)
library(ggthemes)
library(scales)
library(plotly)
library(grid)
library(extrafont)
#read data
econ <- read.csv("https://raw.githubusercontent.com/altaf-ali/ggplot_tutorial/master/data/economist.csv")
#Data Visualisation
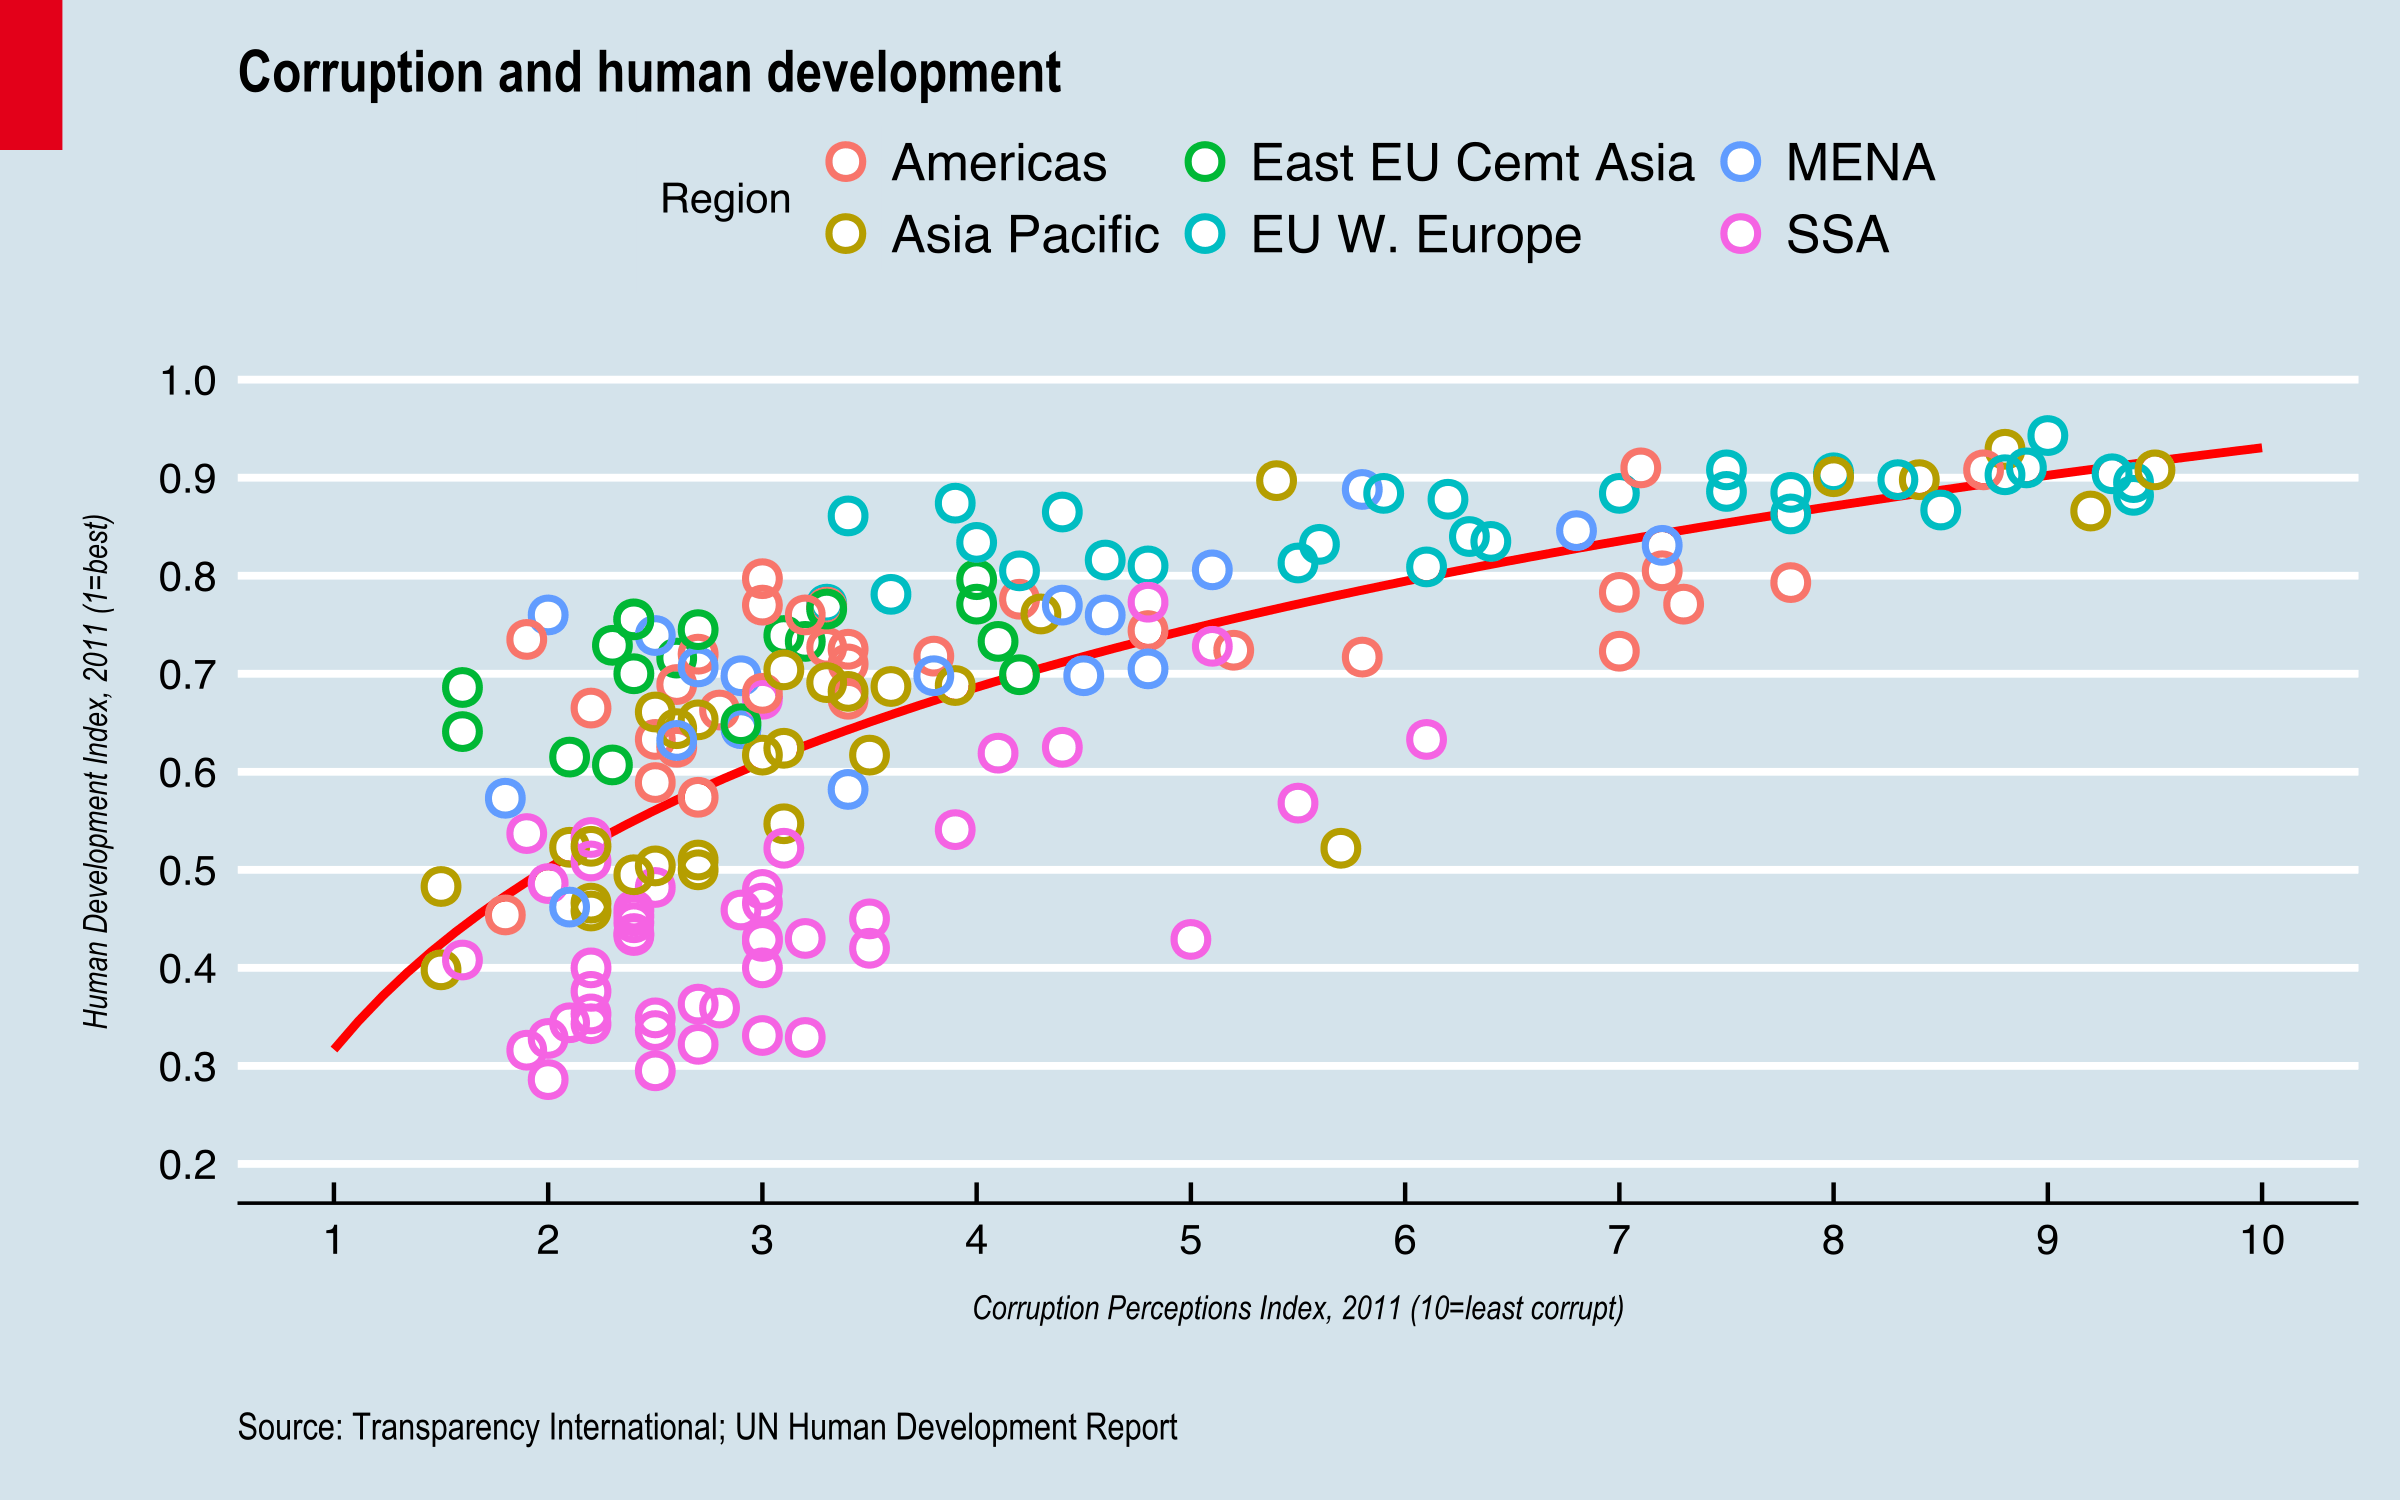
g <- ggplot(econ, aes(CPI,HDI))+geom_smooth(se = FALSE, method = 'lm', fullrange=T,formula=y~log(x), color='red')+
geom_point(stroke=0,color='white',size=3,show.legend = T)
g <- g+ geom_point(aes(color=Region),size=3,pch=1,stroke=1.2)
g <- g+theme_economist()
g <- g+scale_x_continuous(limits = c(1,10), breaks = 1:10)+
scale_y_continuous(limits = c(0.2,1.0),breaks=seq(0.2,1.0,0.1))
labs(title = 'Corruption and human development',
caption='Source: Transparency International; UN Human Development Report')
g <- g+xlab('Corruption Perceptions Index, 2011 (10=least corrupt)')+
ylab('Human Development Index, 2011 (1=best)')
g <- g+theme(plot.title = element_text(family = 'Arial Narrow', size=14,margin=margin(0,0,12,0)),
plot.caption = element_text(family = 'Arial Narrow', hjust=0, margin=margin(10,0,0,0)),
axis.title.x = element_text(family='Arial Narrow', face = 'italic',size=8, margin=margin(10,0,10,0)),
axis.title.y = element_text(family='Arial Narrow', face = 'italic',size=8, margin=margin(0,10,0,10))
)
g
grid.rect(x=0.026, y=0.9,hjust = 1,vjust=0,gp=gpar(fill='#e5001c',lwd=0))
[Выход]
Затем я попытался обозначить некоторые основные страны на графике, поэтому сначала я создал поднабор данных, выполнив следующее:
target_countries <- c(
  "Russia", "Venezuela", "Iraq", "Myanmar", "Sudan",
  "Afghanistan", "Congo", "Greece", "Argentina", "Brazil",
  "India", "Italy", "China", "South Africa", "Spane",
  "Botswana", "Cape Verde", "Bhutan", "Rwanda", "France",
  "United States", "Germany", "Britain", "Barbados", "Norway", "Japan",
  "New Zealand", "Singapore"
)
labeled_countries <- subset(econ, Country %in% target_countries)
Я получил это: Error: Aesthetics must be either length 1 or the same as the data (173): x, y когда я пытался использовать geom_text_repel добавить эти имена в мой сюжет:
g <- g+geom_text_repel(aes(labeled_countries))
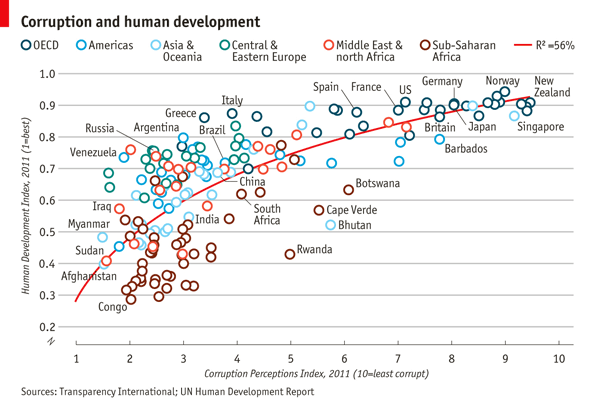
Мой желаемый результат состоит в том, чтобы подражать этой диаграмме Экономиста:
Как мне исправить ошибку?
Дайте мне знать, если мой вопрос достаточно ясен.
Любая помощь приветствуется!
1 ответ
Решение
Установить новый data labeled_countries aesthetic а также label,
g + geom_text_repel(data = labeled_countries, aes(CPI, HDI, label = Country))