Как настроить количество бинов с помощью библиотеки maptools в R
Я пытаюсь создать карту с графиком количества ресторанов в США по округам. Однако из-за большого диапазона значений бинов все округа выглядят очень одинаково по цвету. Как я могу настроить количество бинов, чтобы добавить больше цветов на график.
Я пытался очистить код, но может быть несколько дополнительных строк несвязанного кода ниже, который я использую для других виз.
Вот код, который у меня есть.
##some libraries are not used
library(rgeos)
library(rgdal)
library(maptools)
library(readxl)
library(tmap)
library(gpclib)

#reading data from excel file
#source of the file http://www.ers.usda.gov/datafiles/Food_Environment_Atlas/Data_Access_and_Documentation_Downloads/Current_Version/DataDownload.xls . I am using local file in my computer
data_restaurant <- read_excel(...)
#reading shapes to drawn on the map chart
# I am reading from local file but the actual source is http://www2.census.gov/geo/tiger/GENZ2010/gz_2010_us_050_00_20m.zip
us_shape <- read_shape(..)

#Removing Alaska, Hawaii and Puertorico
us_shape <- us_shape[!(us_shape$STATE %in% c("02","15","72")),]

#assign data to shape
us_shape$FIPS <- paste0(us_shape$STATE, us_shape$COUNTY)
us_shape <- append_data(us_shape, data, key.shp = "FIPS", key.data = "FIPS")
restaurant_shape <- append_data(us_shape, data_restaurant, key.shp = "FIPS", key.data = "FIPS")

#draw the map
draw_map_adult_obs_2010 <- qtm(us_shape, fill = "PCT_OBESE_ADULTS10", fill.palette="Reds",title="2010 Adult Obesity by County, percent",title.position = c("center", "top"))


##This didn't work because of gpclib library not working
##US_states <- unionSpatialPolygons(us_shape, IDs=us_shape$STATE)


#Draw chart restaurant

tm_shape(restaurant_shape, projection="+init=epsg:2163") +
  tm_polygons("FFR12", border.col = "grey30", title="", palette="Reds") +
  tm_borders(lwd=2, col = "black", alpha = .5) +
  tm_layout(title="2012 # of Restaurants by County in USA",
            title.position = c("center", "top"),
            legend.text.size=0.7)

Вот как выглядит карта на данный момент. Как видно из легенд, существует всего 4 группы бинов. Как я могу добавить больше корзин или создать свой. Я потратил много часов, пытаясь найти решение для этого без удачи.
Обновить#
Я наконец смог найти решение, которое искал. Это то что я сделал
tm_shape(restaurant_shape,projection="+init=epsg:2163") +
  tm_fill("FFR12", title = "", style = "fixed",
          breaks = c(0, 50, 150, 250, 500,1000,1500, Inf),
          palette = "Blues") +
  tm_borders() +
  tm_layout(title="2012 # of Restaurants by County in USA",
            title.position = c("center", "top"),
            legend.text.size=0.7)
Мне нравится, как диаграммы выглядят на ggplot2, поэтому я тоже могу попробовать это.
Вот как выглядит график сейчас: 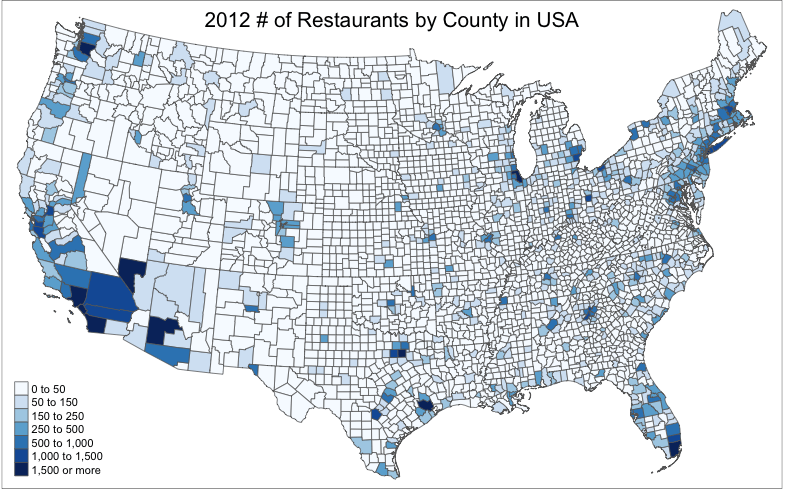
1 ответ
Так как вы в любом случае используете необработанный подсчет (по сравнению с более надежным подходом, таким как нормализация для жителей округов 1К, 10К или 100К), просто переключитесь на использование логарифмического масштаба (вы можете сделать это с помощью тематических карт pkg, но вот решение ggplot2):
library(albersusa) # devtools::install_github("hrbrmstr/albersusa")
library(readxl)
library(dplyr)
library(maptools)
library(rgeos)
library(ggplot2)
library(ggthemes)
library(ggalt)
library(viridis)

URL <- "http://www.ers.usda.gov/datafiles/Food_Environment_Atlas/Data_Access_and_Documentation_Downloads/Current_Version/DataDownload.xls"
fil <- basename(URL)
if (!file.exists(fil)) download.file(URL, fil)

restaurants <- read_excel(fil, 11)

select(restaurants, FIPS, FFR12, FSR12) %>%
  mutate(total=FFR12+FSR12) %>%
  select(FIPS, total) -> restaurants

counties <- counties_composite()

us_map <- fortify(counties, region="fips")

gg <- ggplot()
gg <- gg + geom_map(data=us_map, map=us_map,
                    aes(long, lat, map_id=id),
                    color="#ffffff00", size=0.05, fill=NA)
gg <- gg + geom_map(data=restaurants, map=us_map,
                    aes(fill=total, map_id=FIPS),
                    color="#ffffff", size=0.05)
gg <- gg + scale_fill_viridis(name="Total:", trans="log10")
gg <- gg + coord_proj(us_aeqd_proj)
gg <- gg + theme_map()
gg <- gg + theme(legend.position=c(0.8, 0.25))
gg

Но, пожалуйста, подумайте о нормализации данных.