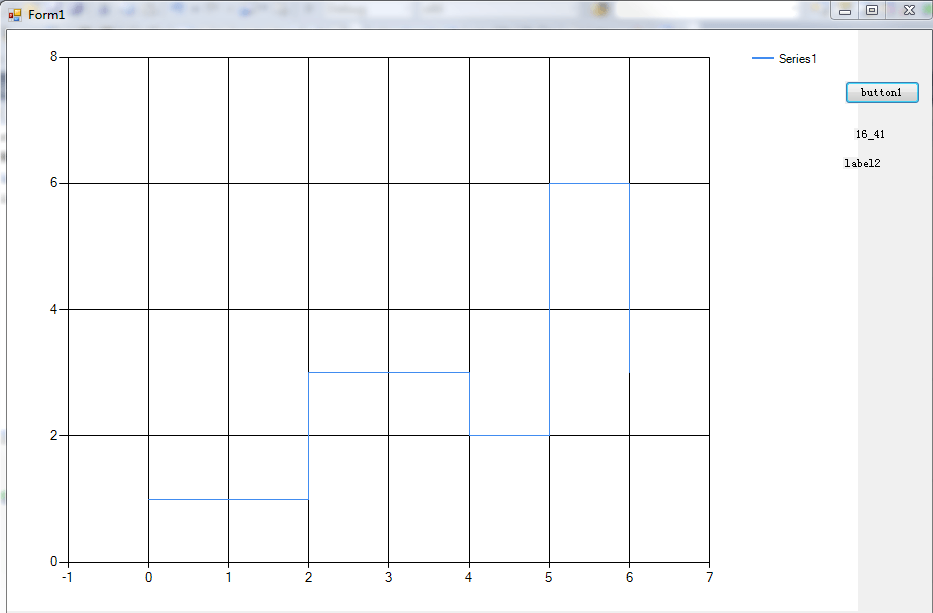
Как я могу изменить фон графика
- Как я могу удалить текст "-----Series1" (вверху справа, рядом с button1)
- Как я могу сделать синий шаг мыслителя и удалить фоновые линии?
- Как можно нарисовать цвет на фоне, например, область от y=0 до y=1, окрашенную в серый цвет.
- Как добавить событие mousewheel, чтобы я мог использовать Ctrl+mousewheel, чтобы увеличивать и уменьшать график?
Спасибо!

1 ответ
Решение
Ниже я привел пример кода, чтобы ответить на ваши вопросы. Мои ответы на 3 и 4 являются основными примерами, и вам нужно будет рассчитать правильные значения для рисования и масштабирования в вашем приложении.
    private void button1_Click(object sender, EventArgs e)
    {
        setupChart();
    }

    private void setupChart()
    {
        // 1.
        foreach (System.Windows.Forms.DataVisualization.Charting.Legend legend in chart1.Legends)
            legend.Enabled = false;

        // 2.
        chart1.Series[0].BorderWidth = 5;
        chart1.ChartAreas[0].AxisX.MajorGrid.Enabled = false;
        chart1.ChartAreas[0].AxisY.MajorGrid.Enabled = false;

        // 3.
        chart1.Paint += new PaintEventHandler(chart1_Paint);

        // 4.
        chart1.MouseWheel += new MouseEventHandler(chart1_MouseWheel);
        //chart must have focus for MouseWheel event to fire
        chart1.Focus();
    }

    private void chart1_Paint(object sender, PaintEventArgs e)
    {
        //basic example of painting

        //determine size of area to paint
        Size areaSize = new Size(50, 50);

        //determine location to paint
        Point point = new Point(100, 450);

        e.Graphics.FillRectangle(new SolidBrush(Color.Gray),
            point.X, point.Y, areaSize.Width, areaSize.Height);
    }

    private void chart1_MouseWheel(object sender, MouseEventArgs e)
    {
        //basic example of zooming in and out
        if (e.Delta > 0)
        {
            chart1.ChartAreas[0].AxisX.ScaleView.Zoom(
                chart1.ChartAreas[0].AxisX.ScaleView.ViewMinimum / 2,
                chart1.ChartAreas[0].AxisX.ScaleView.ViewMaximum / 2);
            chart1.ChartAreas[0].AxisY.ScaleView.Zoom(
                chart1.ChartAreas[0].AxisY.ScaleView.ViewMinimum / 2,
                chart1.ChartAreas[0].AxisY.ScaleView.ViewMaximum / 2);
        }
        else
        {
            if (chart1.ChartAreas[0].AxisX.ScaleView.ViewMaximum <
                chart1.ChartAreas[0].AxisX.Maximum ||
                chart1.ChartAreas[0].AxisX.ScaleView.ViewMinimum >
                chart1.ChartAreas[0].AxisX.Minimum)
            {
                chart1.ChartAreas[0].AxisX.ScaleView.Zoom(
                    chart1.ChartAreas[0].AxisX.ScaleView.ViewMinimum * 2,
                    chart1.ChartAreas[0].AxisX.ScaleView.ViewMaximum * 2);
                chart1.ChartAreas[0].AxisY.ScaleView.Zoom(
                    chart1.ChartAreas[0].AxisY.ScaleView.ViewMinimum * 2,
                    chart1.ChartAreas[0].AxisY.ScaleView.ViewMaximum * 2);
            }
            else
            {
                chart1.ChartAreas[0].AxisX.ScaleView.ZoomReset();
                chart1.ChartAreas[0].AxisY.ScaleView.ZoomReset();
            }
        }
    }