Обнаружение линий с помощью OpenCV Python и преобразования Хафа
Я пытаюсь обнаружить строки таблицы и извлечь полную таблицу из изображения с помощью Python OpenCV и алгоритма Hough Transform. Мне нужно иметь все координаты каждой линии с целью нарисовать одну и ту же таблицу с одинаковыми пропорциями. Я понимаю теорию, как работает преобразование Хафа, и пытался реализовать его без OpenCV, но на больших изображениях он работает очень медленно.
Вот код из примера OpenCV Hough Transfrom
import cv2
import numpy as np

img = cv2.imread('image1.jpg')
gray = cv2.cvtColor(img, cv2.COLOR_BGR2GRAY)
edges = cv2.Canny(gray, 50, 150, apertureSize=3)
cv2.imshow("image", edges)
cv2.waitKey(0)
minLineLength = 100
maxLineGap = 10
lines = cv2.HoughLinesP(edges, 1, np.pi / 180, 50, minLineLength, maxLineGap)
for line in lines:
    for x1, y1, x2, y2 in line:
        cv2.line(img, (x1, y1), (x2, y2), (0, 255, 0), 2)

cv2.imwrite('houghlines5.jpg', img)
Обнаружение Canny Edge вернуло изображение Resulf of Canny Edge Edgee
Но результатом обнаружения является преобразование Resulf of Housh
Я не знаю, почему Hough Transform оставил некоторые строки таблицы. Вы можете порекомендовать что-нибудь сделать? Может быть, другой способ извлечь таблицу из изображения? Спасибо!
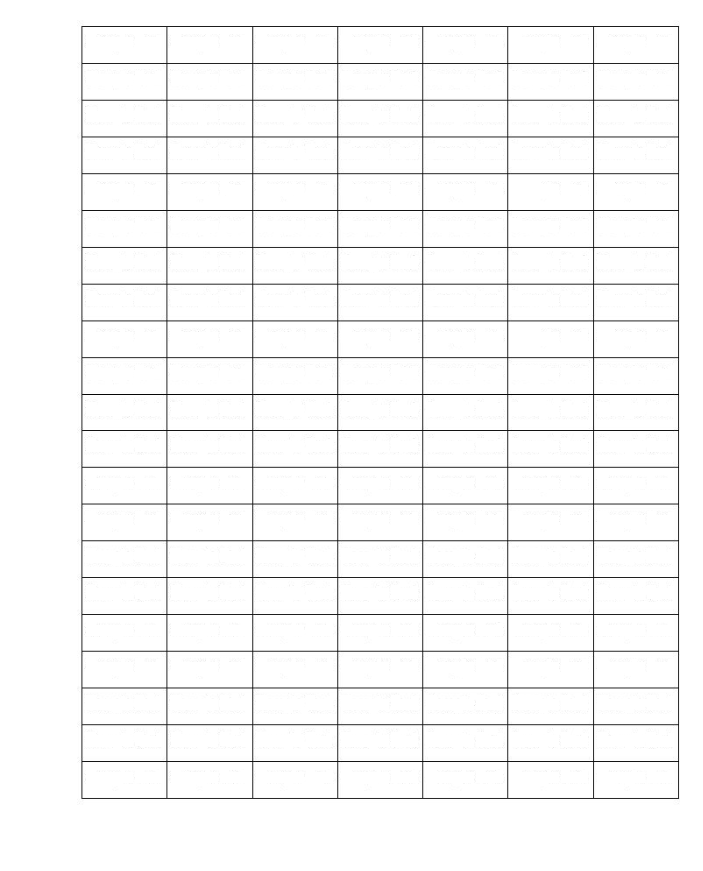
UPD. Исходное изображение оригинальной таблицы, необходимой для обнаружения
2 ответа
Я думаю, что вы должны подготовить изображение, прежде чем выполнять HoughLinesP() например, избавиться от текста, поиграть с параметрами или, возможно, расширить края и т. д. Но если вы хотите извлечь шаблон без текста, вы можете упростить свою жизнь, просто вытянув весь текст из этой таблицы (с помощью поиска небольших контуров и создание белого накладывающего ограничивающего прямоугольника над контурами). В примере кода я сделал три шага: один, сделав шаблон без Hough, второй с HoughLines() и третий с HoughLinesP(), Надеюсь, это поможет немного. Ура!
Пример:
import cv2
import numpy as np

### MAKING TEMPLATE WITHOUT HOUGH

# Read the image and make a copy then transform it to gray colorspace,
# threshold the image and search for contours.
img = cv2.imread('tablelines.png')
res = img.copy()
gray = cv2.cvtColor(img, cv2.COLOR_BGR2GRAY)
_, thresh = cv2.threshold(gray,0,255,cv2.THRESH_BINARY_INV+cv2.THRESH_OTSU)
_, contours, hierarchy = cv2.findContours(thresh,cv2.RETR_TREE,cv2.CHAIN_APPROX_NONE)

# Iterate through contours and draw a slightly bigger white rectangle
# over the contours that are not big enough (the text) on the copy of the image.
for i in contours:
    cnt = cv2.contourArea(i)
    if cnt < 500:
        x,y,w,h = cv2.boundingRect(i)
        cv2.rectangle(res,(x-1,y-1),(x+w+1,y+h+1),(255,255,255),-1)

# Display the result. Note that the image is allready the template!
cv2.imshow('res', res)
cv2.waitKey(0)
cv2.destroyAllWindows()

# Optional count the rows and columns of the table
count = res.copy()
gray = cv2.cvtColor(count, cv2.COLOR_BGR2GRAY)
_, thresh = cv2.threshold(gray,0,255,cv2.THRESH_BINARY+cv2.THRESH_OTSU)
_, contours, hierarchy = cv2.findContours(thresh,cv2.RETR_TREE,cv2.CHAIN_APPROX_NONE)

check = []
for i in contours:
    cnt = cv2.contourArea(i)
    if 10000 > cnt > 10:
        cv2.drawContours(count, [i], 0, (255,255,0), 2)
        M = cv2.moments(i)
        cx = int(M['m10']/M['m00'])
        cy = int(M['m01']/M['m00'])
        check.append([cx, cy])

check.sort(key = lambda xy: xy[1])
columns = 1

for i in range(0, len(check)-1):
    if check[i+1][1] + 5 >= check[i][1] >= check[i+1][1] - 5:
        columns += 1
    else:
        break
print(columns)

check.sort(key = lambda tup: tup[0])
rows = 1
for i in range(0, len(check)-1):
    if check[i+1][0] + 5 >= check[i][0] >= check[i+1][0] - 5:
        rows += 1
    else:
        break
print('Columns: ',columns)
print('Roiws : ',rows)

cv2.imshow('res', count)
cv2.waitKey(0)
cv2.destroyAllWindows()


### LINES WITH HOUGHLINES()

# Convert the resulting image from previous step (no text) to gray colorspace.
res2 = img.copy()
gray = cv2.cvtColor(res, cv2.COLOR_BGR2GRAY)

# You can either use threshold or Canny edge for HoughLines().
_, thresh = cv2.threshold(gray,0,255,cv2.THRESH_BINARY_INV+cv2.THRESH_OTSU)
#edges = cv2.Canny(gray, 50, 150, apertureSize=3)

# Perform HoughLines tranform.
lines = cv2.HoughLines(thresh,1,np.pi/180,200)
for line in lines:
    for rho,theta in line:
            a = np.cos(theta)
            b = np.sin(theta)
            x0 = a*rho
            y0 = b*rho
            x1 = int(x0 + 1000*(-b))
            y1 = int(y0 + 1000*(a))
            x2 = int(x0 - 1000*(-b))
            y2 = int(y0 - 1000*(a))

            cv2.line(res2,(x1,y1),(x2,y2),(0,0,255),2)

#Display the result.
cv2.imshow('res', res)
cv2.imshow('res2', res2)
cv2.waitKey(0)
cv2.destroyAllWindows()


### LINES WITH HOUGHLINESP()

# Convert the resulting image from first step (no text) to gray colorspace.
res3 = img.copy()
gray = cv2.cvtColor(res, cv2.COLOR_BGR2GRAY)

# Use Canny edge detection and dilate the edges for better result.
edges = cv2.Canny(gray, 50, 150, apertureSize=3)
kernel = np.ones((4,4),np.uint8)
dilation = cv2.dilate(edges,kernel,iterations = 1)

# Perform HoughLinesP tranform.
minLineLength = 100
maxLineGap = 10
lines = cv2.HoughLinesP(dilation, 1, np.pi / 180, 50, minLineLength, maxLineGap)
for line in lines:
    for x1, y1, x2, y2 in line:
        cv2.line(res3, (x1, y1), (x2, y2), (0, 255, 0), 2)

#Display the result.
cv2.imwrite('h_res1.png', res)
cv2.imwrite('h_res2.png', res2)
cv2.imwrite('h_res3.png', res3)

cv2.imshow('res', res)
cv2.imshow('res2', res2)
cv2.imshow('res3', res3)
cv2.waitKey(0)
cv2.destroyAllWindows()
Результат:
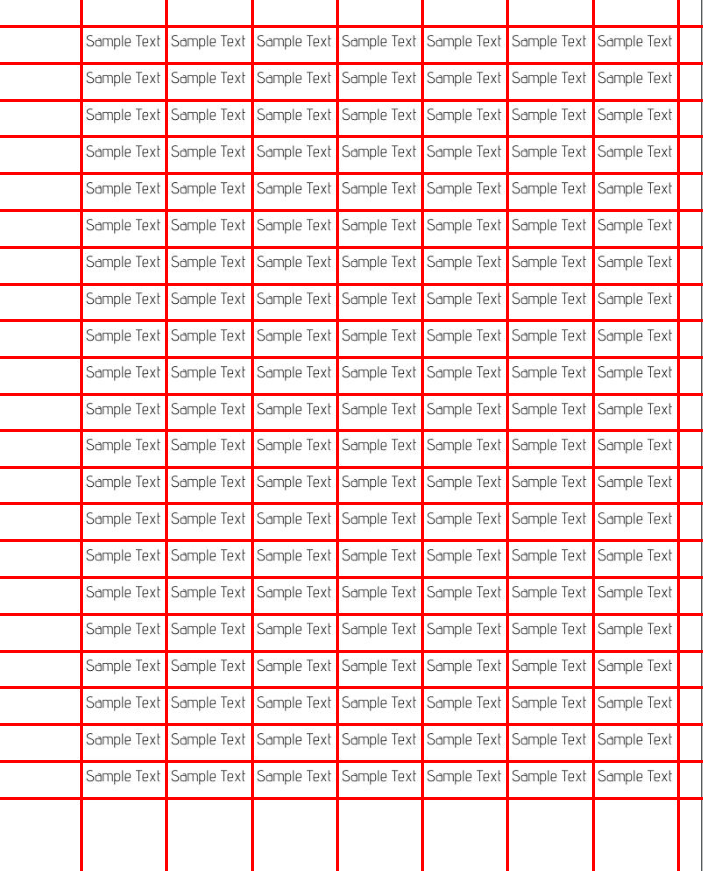
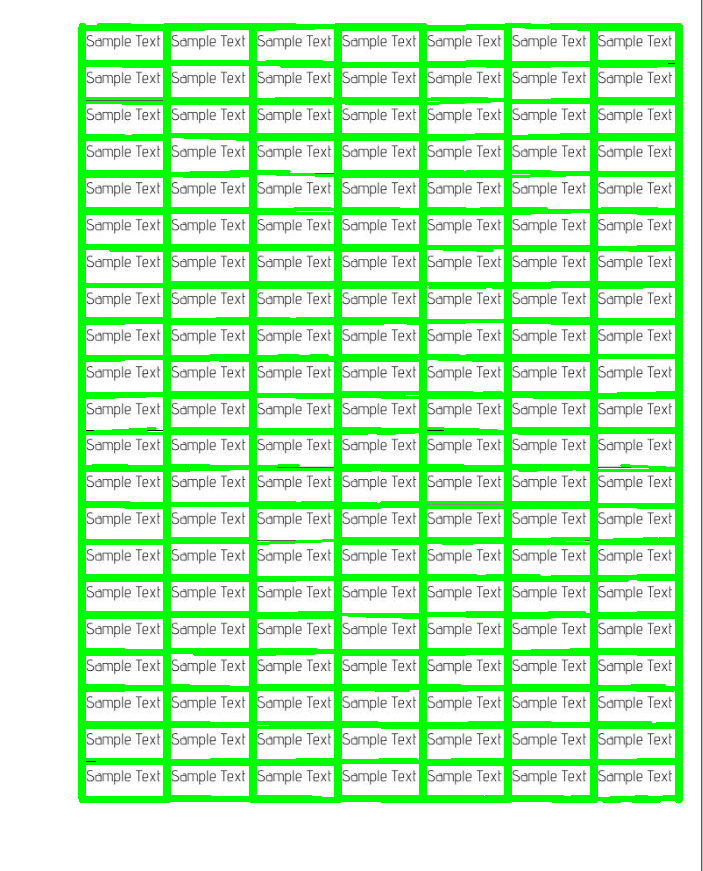
Колонны: 7
Ряды: 21
Я нашел это в документации.
for x1,y1,x2,y2 in lines[0]:
    cv2.line(img,(x1,y1),(x2,y2),(0,255,0),2)
Я не уверен в точной структуре lines но примеры, которые я вижу, повторяют только первый lines[0], Возможно, вы получаете непреднамеренное поведение от for line in lines,