Увеличьте размер меток осей в троичных диаграммах с помощью ggtern
Я хотел бы увеличить размер троичной диаграммы при использовании следующего кода:
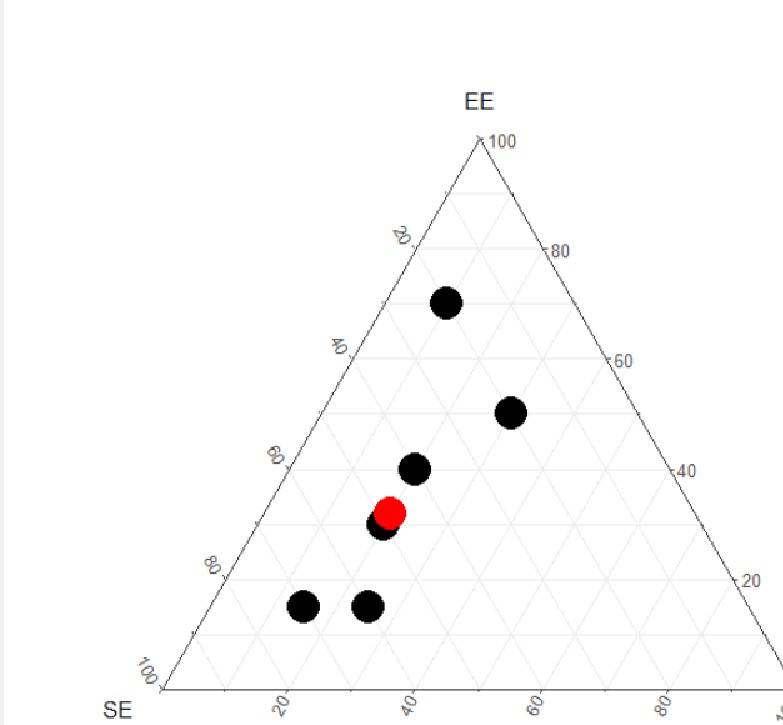
      # Dataset
NP_Mobj
    EE   ES   SE id
1 0.15 0.25 0.60  1
2 0.30 0.20 0.50  1
3 0.15 0.15 0.70  1
4 0.40 0.20 0.40  1
5 0.70 0.10 0.20  1
6 0.50 0.30 0.20  1
7 0.32 0.20 0.48  2
      idNP  <- "1";   idMObj <- "2";
Group <- as.factor(NP_Mobj$id)
 IWRM_Trinagle_NPCriteria_MObj <-  ggtern(NP_Mobj, aes(
    x = SE,
    y = EE,
    z = ES
  ))                                                    +
    geom_point(aes(color = Group ), size = 8)           +
    theme_showarrows()                                  +
    labs(xarrow = "Social equity (SE)",
         yarrow = "Economic efficiency (EE)",
         zarrow = "Environmental sustainability (ES)")  +
    scale_colour_manual(breaks = c(idNP, idMObj),
                        values = c("black", "red"))     +
    theme_clockwise() + theme_bw()
IWRM_Trinagle_NPCriteria_MObj <- IWRM_Trinagle_NPCriteria_MObj +  theme(legend.position="none")
Я хотел бы увеличить размер трех меток осей и значений осей.
1 ответ
Вы можете использоватьaxis.titleиaxis.textаргументыtheme()изменить внешний вид заголовков и текстов осей.
      library(ggtern)
ggtern(NP_Mobj, aes(
  x = SE,
  y = EE,
  z = ES
))                                                    +
  geom_point(aes(color = Group ), size = 8)           +
  theme_showarrows()                                  +
  labs(xarrow = "Social equity (SE)",
       yarrow = "Economic efficiency (EE)",
       zarrow = "Environmental sustainability (ES)")  +
  scale_colour_manual(breaks = c(idNP, idMObj),
                      values = c("black", "red"))     +
  theme_clockwise() +
  theme_bw() +
  theme(legend.position="none",
        axis.text = element_text(size = 18),
        axis.title = element_text(size = 20))
