Как использовать фасеты с ggplot с двойной осью Y
Я пытался расширить свой сценарий отсюда, чтобы использовать аспекты (особенно facet_grid()).
Я видел этот пример, однако я не могу заставить его работать на мой geom_bar() а также geom_point() комбо. Я попытался использовать код из примера, просто изменив facet_wrap в facet_grid который также, казалось, заставлял первый слой не показываться.
Я очень новичок, когда дело доходит до сетки и гробов, так что если кто-то может дать некоторые советы о том, как заставить P1 отображаться с левой осью y, а P2 - с правой, то это было бы здорово.
Данные
library(ggplot2)
library(gtable)
library(grid)
library(data.table)
library(scales)

grid.newpage()

dt.diamonds <- as.data.table(diamonds)

d1 <- dt.diamonds[,list(revenue = sum(price),
                        stones = length(price)),
                  by=c("clarity","cut")]

setkey(d1, clarity,cut)
p1 & p2
p1 <- ggplot(d1, aes(x=clarity,y=revenue, fill=cut)) +
  geom_bar(stat="identity") +
  labs(x="clarity", y="revenue") +
  facet_grid(. ~ cut) +
  scale_y_continuous(labels=dollar, expand=c(0,0)) +
  theme(axis.text.x = element_text(angle = 90, hjust = 1),
        axis.text.y = element_text(colour="#4B92DB"),
        legend.position="bottom")

p2 <- ggplot(d1, aes(x=clarity, y=stones, colour="red")) +
  geom_point(size=6) +
  labs(x="", y="number of stones") + expand_limits(y=0) +
  scale_y_continuous(labels=comma, expand=c(0,0)) +
  scale_colour_manual(name = '',values =c("red","green"), labels = c("Number of Stones"))+
  facet_grid(. ~ cut) +
  theme(axis.text.y = element_text(colour = "red")) +
  theme(panel.background = element_rect(fill = NA),
        panel.grid.major = element_blank(),
        panel.grid.minor = element_blank(),
        panel.border = element_rect(fill=NA,colour="grey50"),
        legend.position="bottom")
Попытка объединить (на основе приведенного выше примера) В первом цикле for это не удается, я подозреваю жесткое кодирование geom_point.points, однако я не знаю, как сделать так, чтобы оно соответствовало моим диаграммам (или достаточно текучим, чтобы соответствовать множеству карт)
# extract gtable
g1 <- ggplot_gtable(ggplot_build(p1))
g2 <- ggplot_gtable(ggplot_build(p2))

combo_grob <- g2
pos <- length(combo_grob) - 1
combo_grob$grobs[[pos]] <- cbind(g1$grobs[[pos]],
                                 g2$grobs[[pos]], size = 'first')

panel_num <- length(unique(d1$cut))
for (i in seq(panel_num))
{
   grid.ls(g1$grobs[[i + 1]])
  panel_grob <- getGrob(g1$grobs[[i + 1]], 'geom_point.points',
                        grep = TRUE, global = TRUE)
  combo_grob$grobs[[i + 1]] <- addGrob(combo_grob$grobs[[i + 1]],
                                       panel_grob)
}


pos_a <- grep('axis_l', names(g1$grobs))
axis <- g1$grobs[pos_a]
for (i in seq(along = axis))
{
  if (i %in% c(2, 4))
  {
    pp <- c(subset(g1$layout, name == paste0('panel-', i), se = t:r))

    ax <- axis[[1]]$children[[2]]
    ax$widths <- rev(ax$widths)
    ax$grobs <- rev(ax$grobs)
    ax$grobs[[1]]$x <- ax$grobs[[1]]$x - unit(1, "npc") + unit(0.5, "cm")
    ax$grobs[[2]]$x <- ax$grobs[[2]]$x - unit(1, "npc") + unit(0.8, "cm")
    combo_grob <- gtable_add_cols(combo_grob, g2$widths[g2$layout[pos_a[i],]$l], length(combo_grob$widths) - 1)
    combo_grob <- gtable_add_grob(combo_grob, ax,  pp$t, length(combo_grob$widths) - 1, pp$b)
  }
}

pp <- c(subset(g1$layout, name == 'ylab', se = t:r))

ia <- which(g1$layout$name == "ylab")
ga <- g1$grobs[[ia]]
ga$rot <- 270
ga$x <- ga$x - unit(1, "npc") + unit(1.5, "cm")

combo_grob <- gtable_add_cols(combo_grob, g2$widths[g2$layout[ia,]$l], length(combo_grob$widths) - 1)
combo_grob <- gtable_add_grob(combo_grob, ga, pp$t, length(combo_grob$widths) - 1, pp$b)
combo_grob$layout$clip <- "off"

grid.draw(combo_grob)
РЕДАКТИРОВАТЬ, чтобы попытаться сделать работоспособным дляfacet_wrap
Следующий код все еще работает с facet_grid с помощью ggplot2 2.0.0
g1 <- ggplot_gtable(ggplot_build(p1))
g2 <- ggplot_gtable(ggplot_build(p2))

pp <- c(subset(g1$layout, name == "panel", se = t:r))
g <- gtable_add_grob(g1, g2$grobs[which(g2$layout$name == "panel")], pp$t,
                     pp$l, pp$b, pp$l)
# axis tweaks
ia <- which(g2$layout$name == "axis-l")
ga <- g2$grobs[[ia]]
ax <- ga$children[[2]]
ax$widths <- rev(ax$widths)
ax$grobs <- rev(ax$grobs)
ax$grobs[[1]]$x <- ax$grobs[[1]]$x - unit(1, "npc") + unit(0.15, "cm")
g <- gtable_add_cols(g, g2$widths[g2$layout[ia, ]$l], length(g$widths) - 1)
g <- gtable_add_grob(g, ax, unique(pp$t), length(g$widths) - 1)

# Add second y-axis title
ia <- which(g2$layout$name == "ylab")
ax <- g2$grobs[[ia]]
# str(ax) # you can change features (size, colour etc for these -
# change rotation below
ax$rot <- 90
g <- gtable_add_cols(g, g2$widths[g2$layout[ia, ]$l], length(g$widths) - 1)
g <- gtable_add_grob(g, ax, unique(pp$t), length(g$widths) - 1)

# Add legend to the code
leg1 <- g1$grobs[[which(g1$layout$name == "guide-box")]]
leg2 <- g2$grobs[[which(g2$layout$name == "guide-box")]]

g$grobs[[which(g$layout$name == "guide-box")]] <-
  gtable:::cbind_gtable(leg1, leg2, "first")

grid.draw(g)
2 ответа
РЕДАКТИРОВАТЬ: ОБНОВЛЕНО GGPLOT 2.2.0
Но ggplot2 теперь поддерживает вторичные оси Y, поэтому нет необходимости в манипуляциях с гробами. Смотрите решение @Axeman.
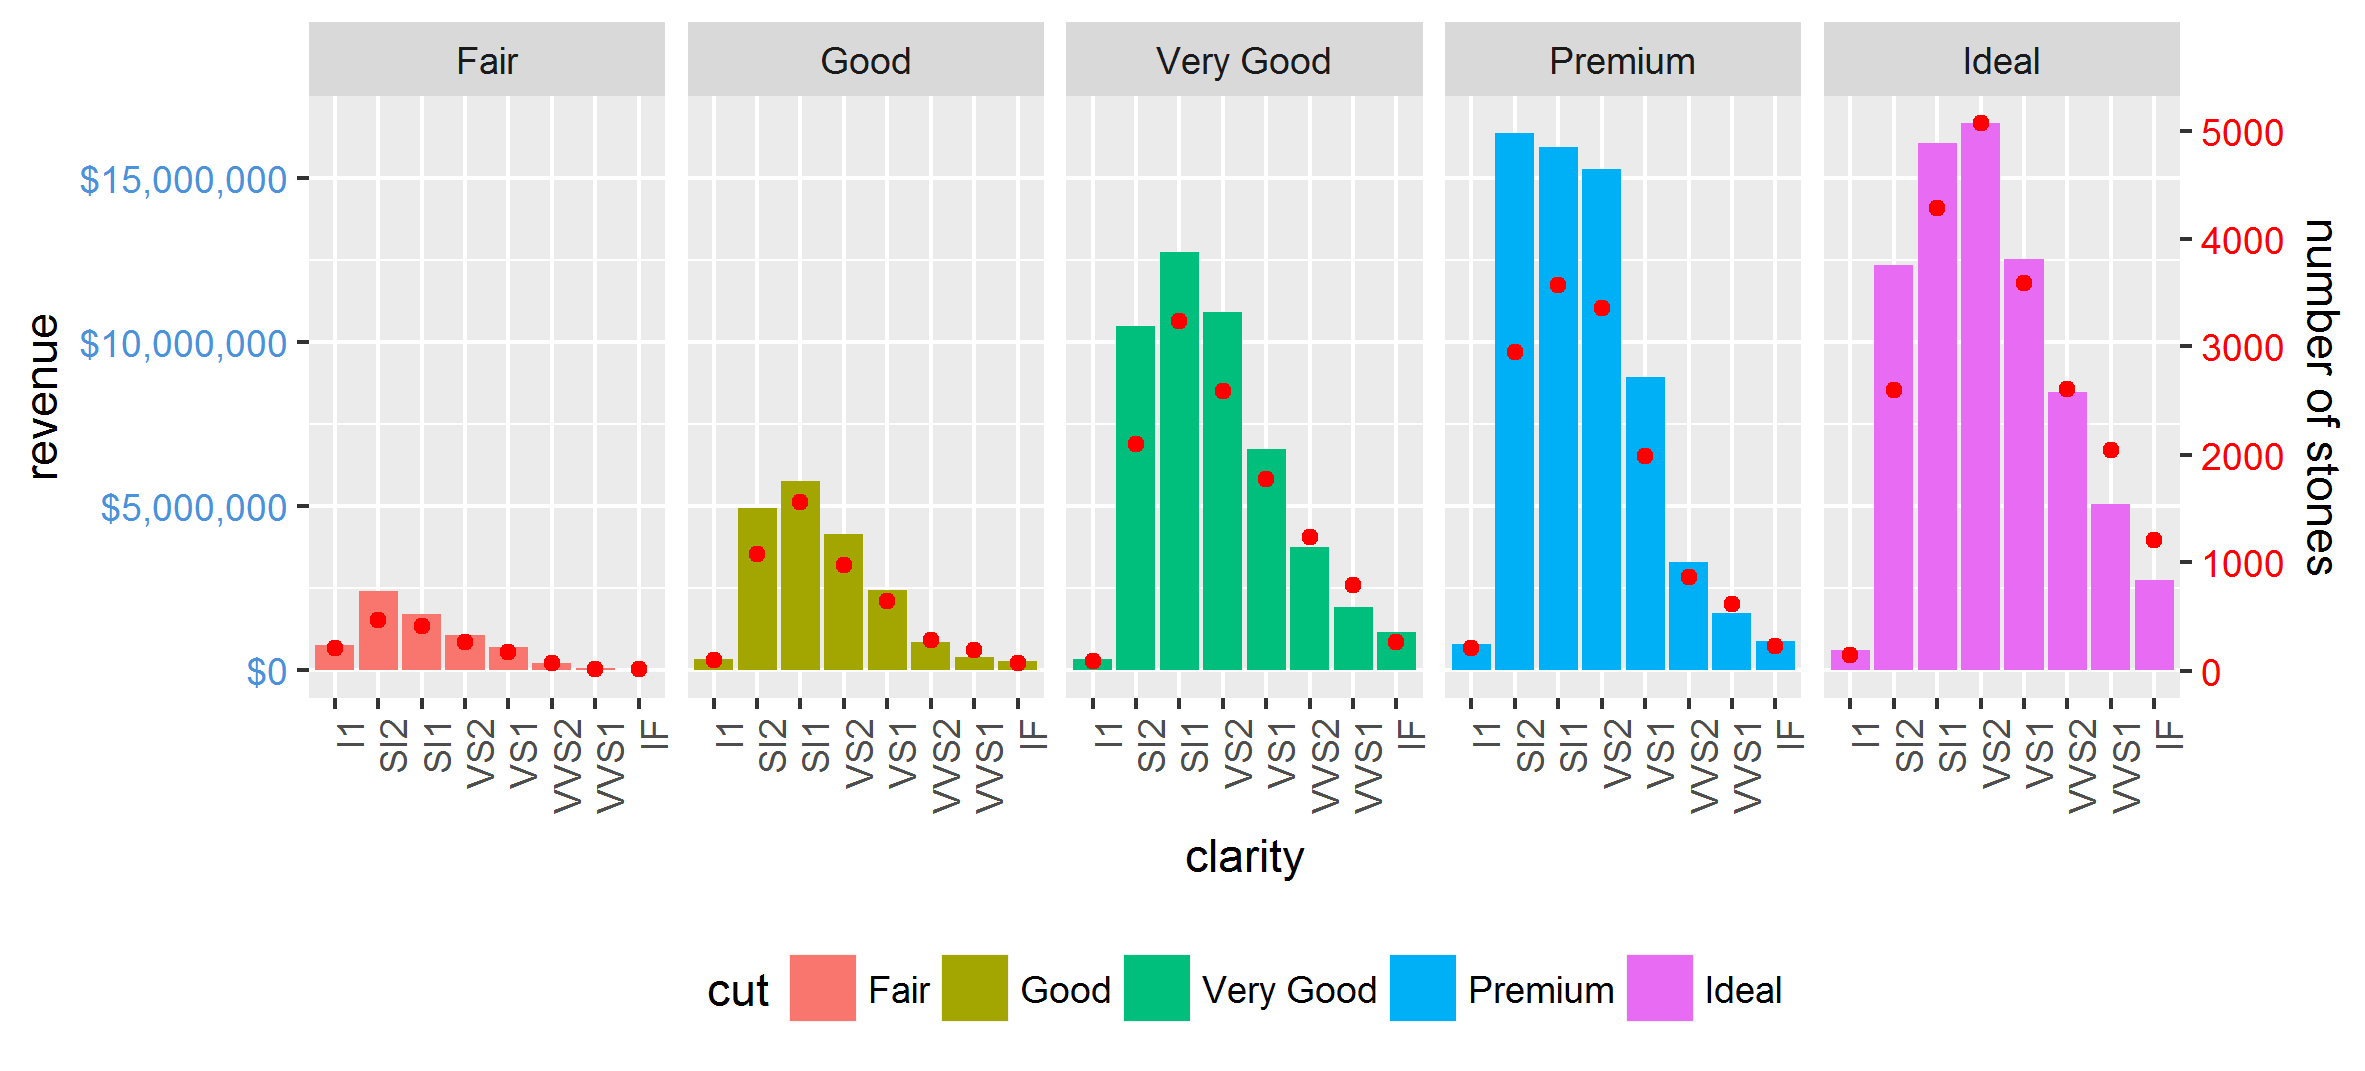
facet_grid а также facet_wrap Графики генерируют разные наборы имен для панелей и левых осей. Вы можете проверить имена, используя g1$layout где g1 <- ggplotGrob(p1)и p1 рисуется первым с facet_grid()затем второй с facet_wrap(), В частности, с facet_grid() все сюжетные панели называются "панель", тогда как с facet_wrap() они имеют разные названия: "панель-1", "панель-2" и т. д. Итак, такие команды:
pp <- c(subset(g1$layout, name == "panel", se = t:r))
g <- gtable_add_grob(g1, g2$grobs[which(g2$layout$name == "panel")], pp$t,
                     pp$l, pp$b, pp$l)
потерпит неудачу с графиками, созданными с использованием facet_wrap, Я бы использовал регулярные выражения, чтобы выбрать все имена, начинающиеся с "панели". Есть похожие проблемы с "осью-l".
Кроме того, ваши команды настройки оси работали для более старых версий ggplot, но начиная с версии 2.1.0 метки не совсем соответствуют правому краю графика, а метки и метки слишком близки друг к другу.
Вот что я бы сделал (опираясь на код отсюда, который, в свою очередь, опирается на код отсюда и из пакета cowplot).
# Packages
library(ggplot2)
library(gtable)
library(grid)
library(data.table)
library(scales)

# Data
dt.diamonds <- as.data.table(diamonds)
d1 <- dt.diamonds[,list(revenue = sum(price),
                        stones = length(price)),
                  by=c("clarity", "cut")]
setkey(d1, clarity, cut)

# The facet_wrap plots
p1 <- ggplot(d1, aes(x = clarity, y = revenue, fill = cut)) +
  geom_bar(stat = "identity") +
  labs(x = "clarity", y = "revenue") +
  facet_wrap( ~ cut, nrow = 1) +
  scale_y_continuous(labels = dollar, expand = c(0, 0)) +
  theme(axis.text.x = element_text(angle = 90, hjust = 1),
        axis.text.y = element_text(colour = "#4B92DB"),
        legend.position = "bottom")

p2 <- ggplot(d1, aes(x = clarity, y = stones, colour = "red")) +
  geom_point(size = 4) +
  labs(x = "", y = "number of stones") + expand_limits(y = 0) +
  scale_y_continuous(labels = comma, expand = c(0, 0)) +
  scale_colour_manual(name = '', values = c("red", "green"), labels = c("Number of Stones"))+
  facet_wrap( ~ cut, nrow = 1) +
  theme(axis.text.y = element_text(colour = "red")) +
  theme(panel.background = element_rect(fill = NA),
        panel.grid.major = element_blank(),
        panel.grid.minor = element_blank(),
        panel.border = element_rect(fill = NA, colour = "grey50"),
        legend.position = "bottom")


# Get the ggplot grobs
g1 <- ggplotGrob(p1)
g2 <- ggplotGrob(p2)

# Get the locations of the plot panels in g1.
pp <- c(subset(g1$layout, grepl("panel", g1$layout$name), se = t:r))

# Overlap panels for second plot on those of the first plot
g <- gtable_add_grob(g1, g2$grobs[grepl("panel", g1$layout$name)],
      pp$t, pp$l, pp$b, pp$l)


# ggplot contains many labels that are themselves complex grob;
# usually a text grob surrounded by margins.
# When moving the grobs from, say, the left to the right of a plot,
# Make sure the margins and the justifications are swapped around.
# The function below does the swapping.
# Taken from the cowplot package:
# https://github.com/wilkelab/cowplot/blob/master/R/switch_axis.R

hinvert_title_grob <- function(grob){

  # Swap the widths
  widths <- grob$widths
  grob$widths[1] <- widths[3]
  grob$widths[3] <- widths[1]
  grob$vp[[1]]$layout$widths[1] <- widths[3]
  grob$vp[[1]]$layout$widths[3] <- widths[1]

  # Fix the justification
  grob$children[[1]]$hjust <- 1 - grob$children[[1]]$hjust
  grob$children[[1]]$vjust <- 1 - grob$children[[1]]$vjust
  grob$children[[1]]$x <- unit(1, "npc") - grob$children[[1]]$x
  grob
}

# Get the y axis title from g2
index <- which(g2$layout$name == "ylab-l") # Which grob contains the y axis title?   EDIT HERE
ylab <- g2$grobs[[index]]                # Extract that grob
ylab <- hinvert_title_grob(ylab)         # Swap margins and fix justifications

# Put the transformed label on the right side of g1
g <- gtable_add_cols(g, g2$widths[g2$layout[index, ]$l], max(pp$r))
g <- gtable_add_grob(g, ylab, max(pp$t), max(pp$r) + 1, max(pp$b), max(pp$r) + 1, clip = "off", name = "ylab-r")

# Get the y axis from g2 (axis line, tick marks, and tick mark labels)
index <- which(g2$layout$name == "axis-l-1-1")  # Which grob.    EDIT HERE
yaxis <- g2$grobs[[index]]                    # Extract the grob

# yaxis is a complex of grobs containing the axis line, the tick marks, and the tick mark labels.
# The relevant grobs are contained in axis$children:
#   axis$children[[1]] contains the axis line;
#   axis$children[[2]] contains the tick marks and tick mark labels.

# First, move the axis line to the left
# But not needed here
# yaxis$children[[1]]$x <- unit.c(unit(0, "npc"), unit(0, "npc"))

# Second, swap tick marks and tick mark labels
ticks <- yaxis$children[[2]]
ticks$widths <- rev(ticks$widths)
ticks$grobs <- rev(ticks$grobs)

# Third, move the tick marks
# Tick mark lengths can change.
# A function to get the original tick mark length
# Taken from the cowplot package:
# https://github.com/wilkelab/cowplot/blob/master/R/switch_axis.R
plot_theme <- function(p) {
  plyr::defaults(p$theme, theme_get())
}

tml <- plot_theme(p1)$axis.ticks.length   # Tick mark length
ticks$grobs[[1]]$x <- ticks$grobs[[1]]$x - unit(1, "npc") + tml

# Fourth, swap margins and fix justifications for the tick mark labels
ticks$grobs[[2]] <- hinvert_title_grob(ticks$grobs[[2]])

# Fifth, put ticks back into yaxis
yaxis$children[[2]] <- ticks

# Put the transformed yaxis on the right side of g1
g <- gtable_add_cols(g, g2$widths[g2$layout[index, ]$l], max(pp$r))
g <- gtable_add_grob(g, yaxis, max(pp$t), max(pp$r) + 1, max(pp$b), max(pp$r) + 1,
   clip = "off", name = "axis-r")

# Get the legends
leg1 <- g1$grobs[[which(g1$layout$name == "guide-box")]]
leg2 <- g2$grobs[[which(g2$layout$name == "guide-box")]]

# Combine the legends
g$grobs[[which(g$layout$name == "guide-box")]] <-
    gtable:::cbind_gtable(leg1, leg2, "first")

# Draw it
grid.newpage()
grid.draw(g)
Теперь, когда ggplot2 имеет поддержку вторичной оси, это стало намного легче во многих (но не во всех) случаях. Нет необходимости в манипуляциях с грабами.
Несмотря на то, что предполагается, что он допускает только простые линейные преобразования одних и тех же данных, таких как разные шкалы измерения, мы можем сначала вручную перемасштабировать одну из переменных, чтобы, по крайней мере, получить гораздо больше от этого свойства.
library(tidyverse)

max_stones <- max(d1$stones)
max_revenue <- max(d1$revenue)

d2 <- gather(d1, 'var', 'val', stones:revenue) %>%
  mutate(val = if_else(var == 'revenue', as.double(val), val / (max_stones / max_revenue)))

ggplot(mapping = aes(clarity, val)) +
  geom_bar(aes(fill = cut), filter(d2, var == 'revenue'), stat = 'identity') +
  geom_point(data = filter(d2, var == 'stones'), col = 'red') +
  facet_grid(~cut) +
  scale_y_continuous(sec.axis = sec_axis(trans = ~ . * (max_stones / max_revenue),
                                         name = 'number of stones'),
                     labels = dollar) +
  theme(axis.text.x = element_text(angle = 90, hjust = 1),
        axis.text.y = element_text(color = "#4B92DB"),
        axis.text.y.right = element_text(color = "red"),
        legend.position="bottom") +
  ylab('revenue')
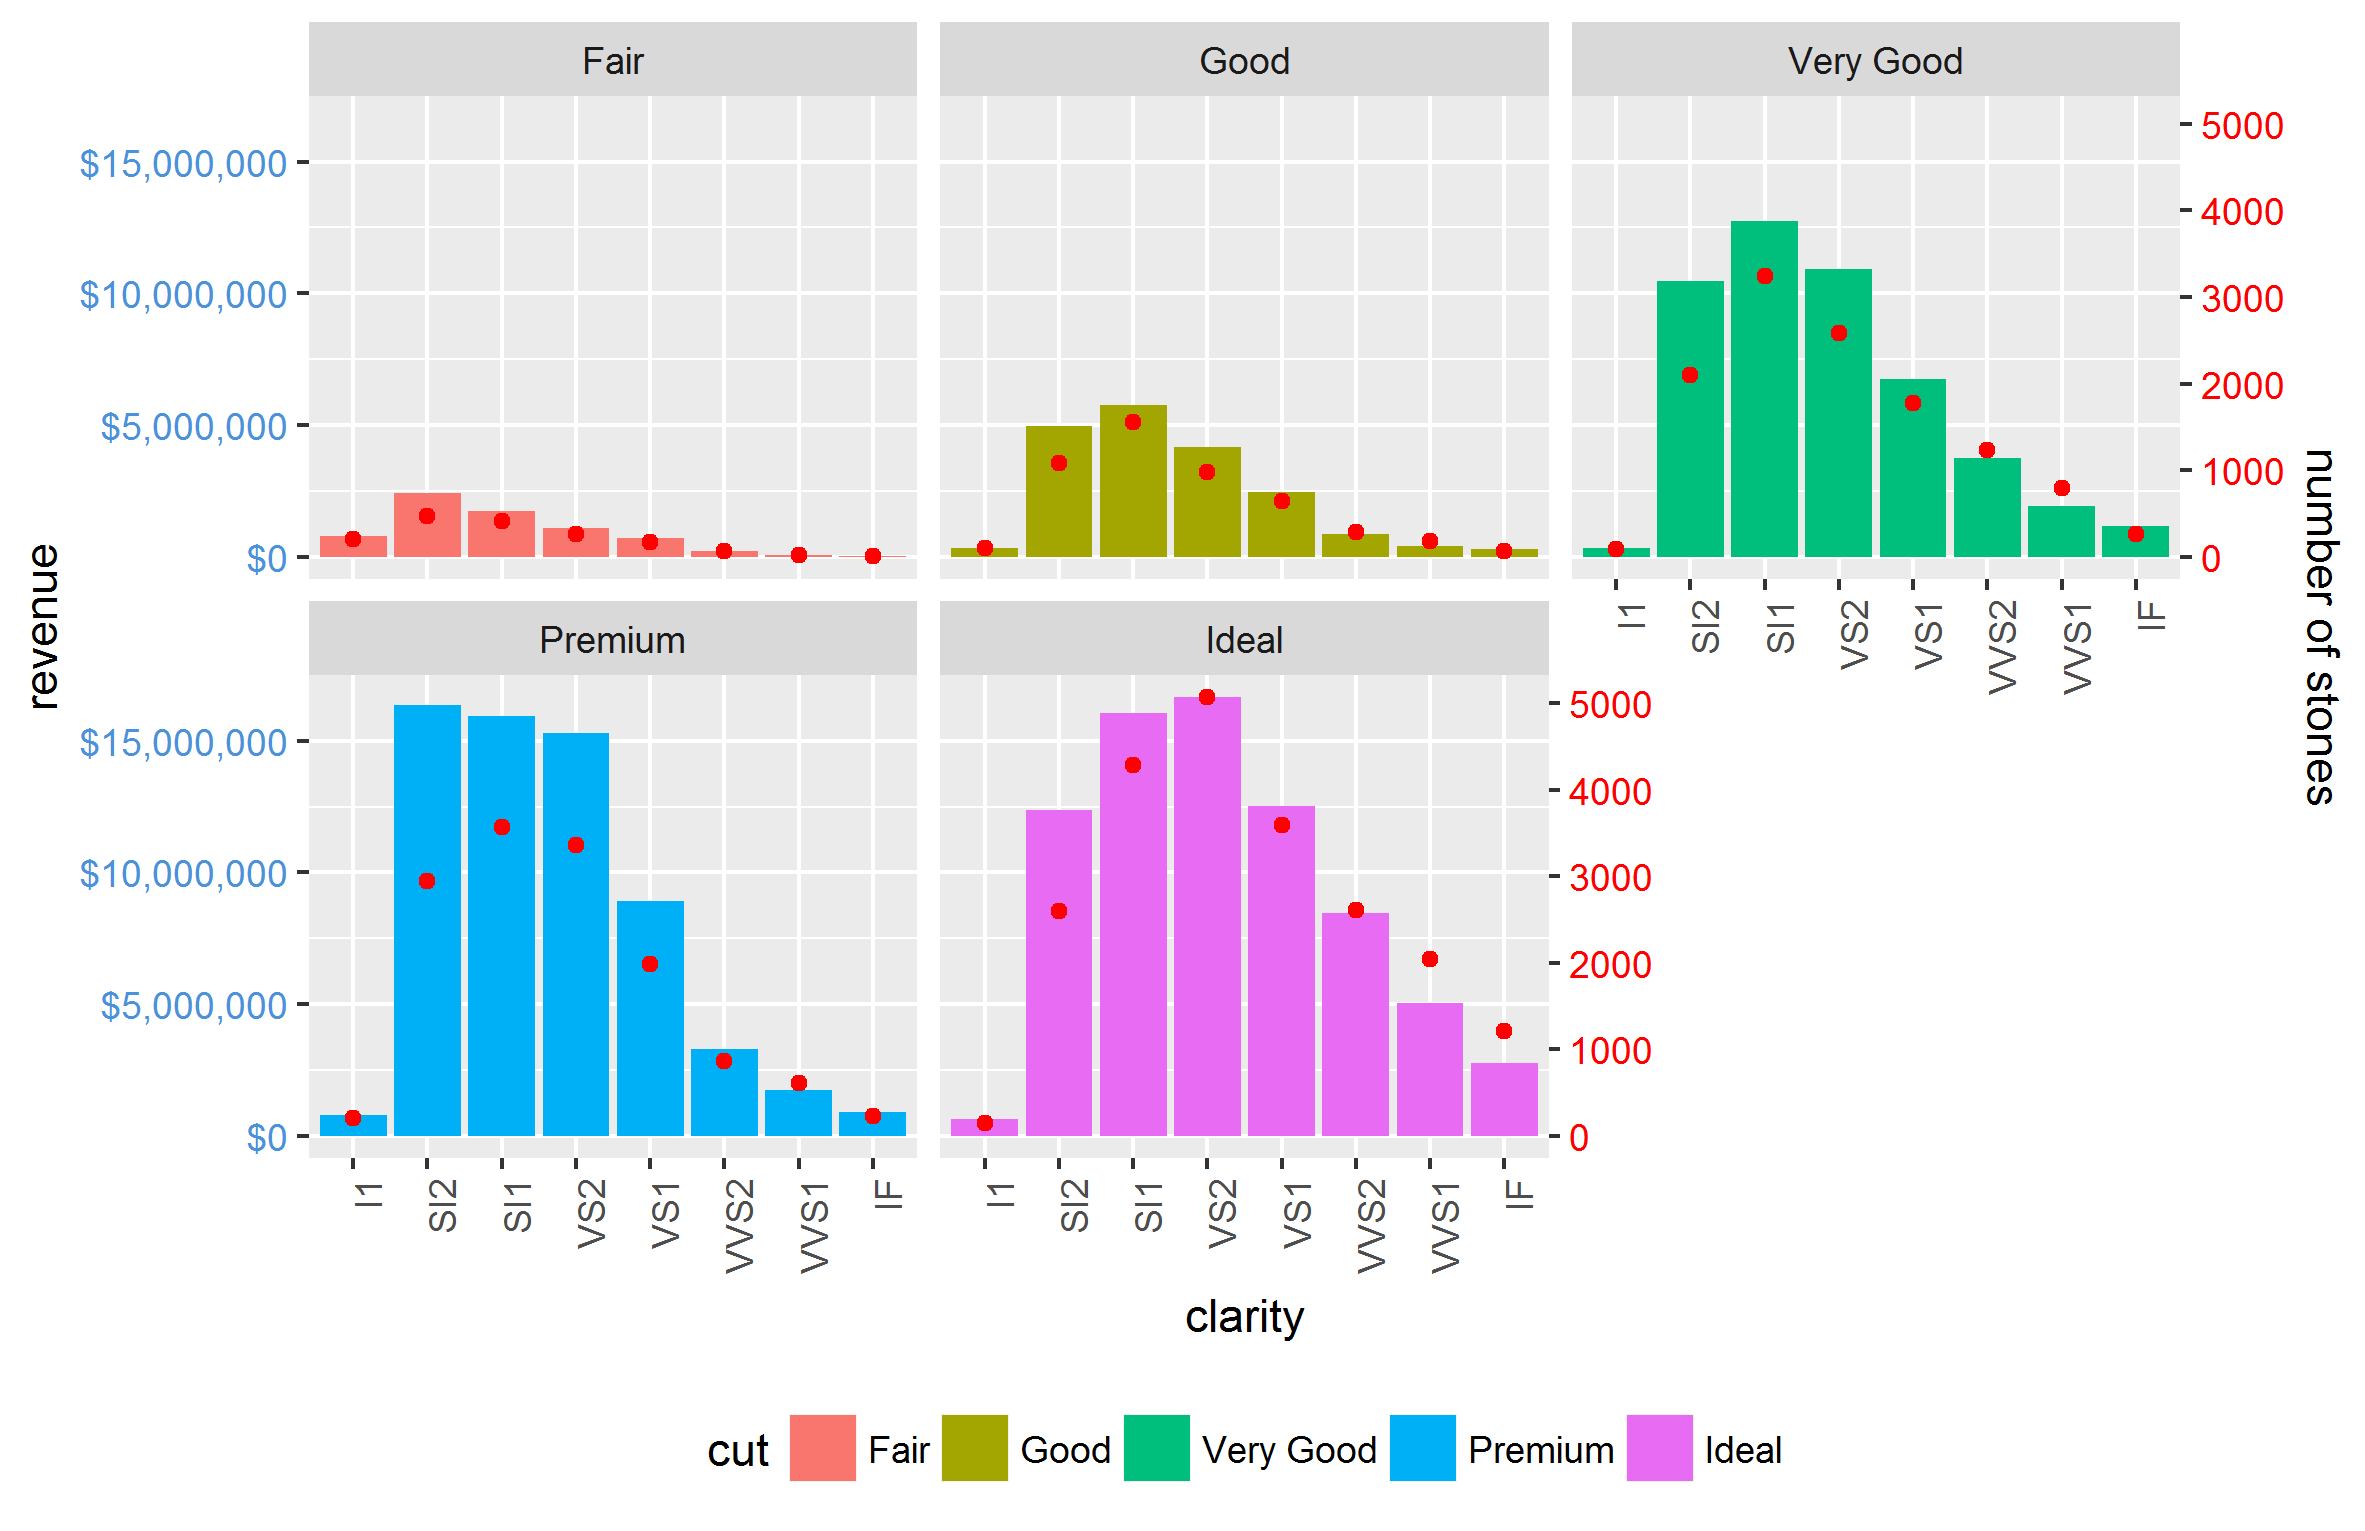
Это также хорошо работает с facet_wrap:
Другие осложнения, такие как scales = 'free' а также space = 'free' также сделано легко. Единственное ограничение заключается в том, что отношения между двумя осями одинаковы для всех аспектов.


