Матрица lsim() и симуляция цикла for // Различные результаты для одной и той же системы
Я потратил довольно много времени, пытаясь смоделировать простую систему SISO, используя два подхода:
1) Использование lsim() в MATLAB 2) Записывая разностные уравнения самостоятельно и перебирая их в цикле.
Мне никогда не удавалось получить одинаковые результаты моделирования от обоих подходов, и я понятия не имею, что я делаю неправильно.
Я сложил свой код в один m-файл, чтобы его было проще понять. Вот код:
function main()
clear all
clc

simulateUsing_lsim()
simulateUsing_loop()

end


%%%%%% Simulating using lsim %%%%%%%
function simulateUsing_lsim()

% Define the continuous-time closed-loop system
P           = getContPlant();
[Kp,Ki,Kd]  = get_PIDgains();
C           = pid(Kp,Ki,Kd);
clSys_cont  = feedback(C*P,1);

% Define the discrete-time closed-loop system
hk          = get_sampling_time();
clSys_disc  = c2d(clSys_cont,hk);

% Generate the reference signal and the time vector
[r,t] = getReference(hk);

%% Simulate and plot using lsim
figure
lsim(clSys_disc,r,t)

%% Finding and plotting the error
y   = lsim(clSys_disc,r);
e   = r - y;
figure
p   = plot(t,e,'b--');
set(p,'linewidth',2)
legend('error')
xlabel('Time (seconds)')
ylabel('error')
% xlim([-.1 10.1])
end

%%%%%% Simulating using loop iteration (difference equations) %%%%%%%
function simulateUsing_loop()

% Get the cont-time ol-sys
P       = getContPlant();

% Get the sampling time
hk      = get_sampling_time();

% Get the disc-time ol-sys in SS representation
P_disc  = ss(c2d(P,hk));
Ad      = P_disc.A;
Bd      = P_disc.B;
Cd      = P_disc.C;

% Get the PID gains
[Kp,Ki,Kd]  = get_PIDgains();

% Generate the reference signal and the time vector
[r,t] = getReference(hk);

%% Perform the system simulation
x            = [0 0]';   % Set initial states
e            = 0;        % Set initial errors
integral_sum = 0;        % Set initial integral part value

for i=2:1:length(t)

% Calculate the output signal "y"
y(:,i)  = Cd*x;

% Calculate the error "e"
e(:,i)  = y(:,i) - r(i);

% Calculate the control signal vector "u"
integral_sum = integral_sum + Ki*hk*e(i);
u(:,i)       = Kp*e(i) + integral_sum + (1/hk)*Kd*(e(:,i)-e(:,i-1));

% Saturation. Limit the value of u withing the range [-tol tol]
% tol = 100;
% if abs(u(:,i)) > tol
%     u(:,i) = tol * abs(u(:,i))/u(:,i);
% else
% end

% Calculate the state vector "x"
x       = Ad*x + Bd*u(:,i);    % State transitions to time n

end

%% Subplots
figure
plot(t,y,'b',t,r,'g--')

%% Plotting the error
figure
p = plot(t,e,'r');
set(p,'linewidth',2)
legend('error')
xlabel('Time (seconds)')
ylabel('error')

end

function P = getContPlant()
s   = tf('s');
P   = 1/(s^2 + 10*s + 20);
end

function [Kp,Ki,Kd]  = get_PIDgains()
Kp  = 350;
Ki  = 300;
Kd  = 50;
end

function hk = get_sampling_time()
hk = 0.01;
end

function [r,t] = getReference(hk)
[r,t] = gensig('square',4,10,hk);
end
Я получил модель растения P и его ПИД-регулятор с этой страницы (см. уравнение 10), где система имитируется по эталону шага, и результат выглядит почти так же, как lsim() результат (только для одного шага пика).
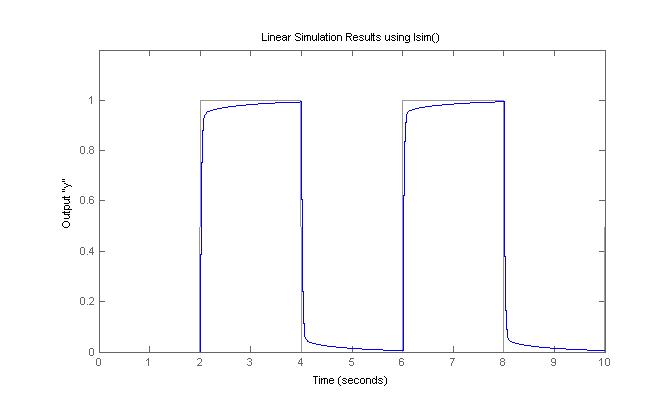
Тем не менее, результат моделирования системы с помощью lsim() это:
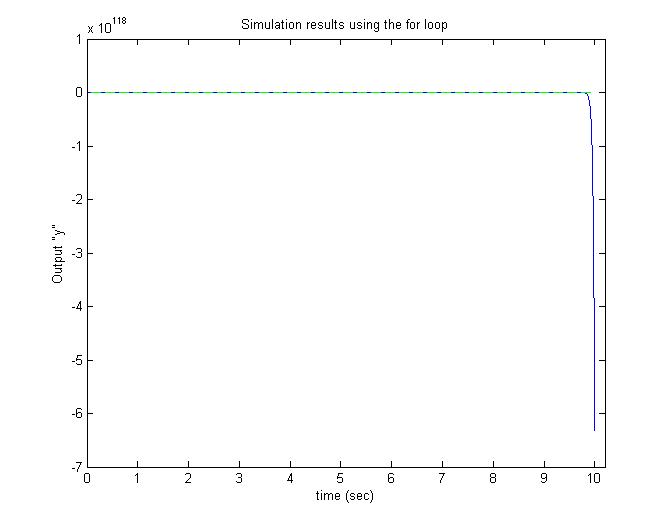
тогда как, используя цикл for, я получил такую производительность:
Я был бы очень признателен за любую помощь или разъяснение, почему я получаю разные результаты.

