Stacked bar chart does not show bar values for time series X axis - ReactJS Recharts
I have some JSON data which is going to be displayed in a Stacked Bar chart using RechartJS in a ReactJS application.
I use
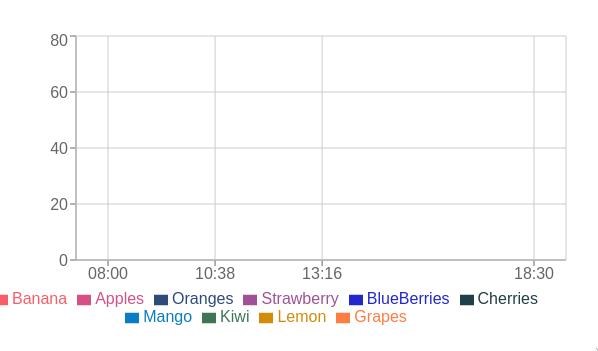
type="number" for the X axis to dispaly the data in a time series, but here's how the chart is displayed:
As you can see: there is data but bars does not get displayed, using
type="category" for the X axis will show the bars, but that wont provide a way to show dates with empty data unless those dates got filled in the JSON.
The data is an array of objects that look like this:
          [
      {
        "date": 1632200400000,
        "Banana": 4,
        "Apples": 15,
        "Oranges": 12,
        "Strawberry": 10,
        "BlueBerries": 8,
        "Cherries": 8,
        "Mango": 2,
        "Kiwi": 4,
        "Lemon": 4,
        "Grapes": 6
      },
      ...
    ]
Also there is an array of items for the bars:
      [
  "Banana",
  "Apples",
  "Oranges",
  "Strawberry",
  "BlueBerries",
  "Cherries",
  "Mango",
  "Kiwi",
  "Lemon",
  "Grapes"
]
The code looks like this:
      <BarChart data={data} width={600} height={300}>
  <XAxis
    dataKey="date"
    domain={["dataMin", "dataMax"]}
    padding={{ left: 32, right: 32 }}
    type="number"
    interval={0}
    tickFormatter={(time) => format(new Date(time), "HH:mm")}
  />
  <YAxis width={100} orientation="left" />

  {items.map((itemName) => (
    <Bar
      barSize={20}
      dataKey={itemName}
      stackId="a"
      fill={generateColor()}
    />
  ))}

  <CartesianGrid />
  <Tooltip />
  <Legend />
</BarChart>
Here you can find the codesandbox for the code: https://codesandbox.io/s/recharts-stackbar-time-series-3z8s5
