Как выровнять и пометить слой в галлювиальном с помощью ggrepel (или иным способом)
У меня есть несколько наносных участков, которые я создал с помощью
ggalluvial в R.
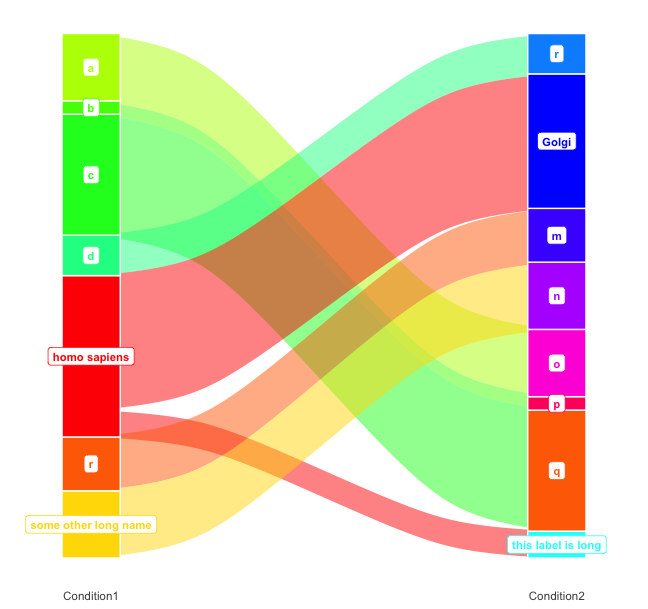
В приведенном ниже примере кода получается что-то близкое к тому, чего я хочу достичь. Например,
      library("ggalluvial")
par(mar = c(1,1,1,1)*12, cex = 0.6, xpd=NA)

# generate some example data
somelongnames <- c("homo sapiens", "homo sapiens", letters[18],
                   "some other long name", letters[seq(4)])

df <- data.frame(x = factor(somelongnames),
                 y = factor(c("this label is long", "Golgi",
                       letters[13:18])),
                 count = c(2, 10, 4, 5, 5, 1, 9, 3))

ll <- unique(c(as.character(df$x), as.character(df$y)))
grid.col <- rainbow(length(ll))
grid.col <- setNames(grid.col, ll)

# set colours for alluvial plot (this is a little tricky as strata
# colour ordering is required for ggalluvial strata)
names(df) <- c("Condition1", "Condition2", "value")
levs1 <- levels(df$Condition1)
levs2 <- levels(df$Condition2)
res1 <- unique(df$Condition1)
res2 <- unique(df$Condition2)
cond1_cols <- grid.col[levs1[levs1 %in% res1]]
cond2_cols <- grid.col[levs2[levs2 %in% res2]]
columnCols <- c(cond1_cols, cond2_cols)
stratCols <- c(rev(cond1_cols), rev(cond2_cols))

# plot alluvial diagram
q <- ggplot(df,
            aes(y = value, axis1 = Condition1, axis2 = Condition2)) +
  geom_alluvium(aes(fill = Condition1), width = 0) +
  scale_fill_manual(values = columnCols) +
  geom_stratum(width = 1/8, fill = paste0(stratCols), color = "white") +
  scale_x_discrete(limits = c("Condition1", "Condition2"),
                   expand = c(.09, .09)) +
  scale_y_continuous(breaks = NULL) +
  theme_minimal() +
  theme(axis.ticks.y = element_blank(),
        axis.text.y = element_blank(),
        panel.grid.major.y = element_blank(),
        panel.grid.major.x = element_blank()) +
  theme(legend.position = "none") +
  ylab(NULL)

# add labels
  q +
    geom_label(stat = "stratum", aes(label = after_stat(stratum)),
               color = stratCols, fontface = "bold", size = 3)
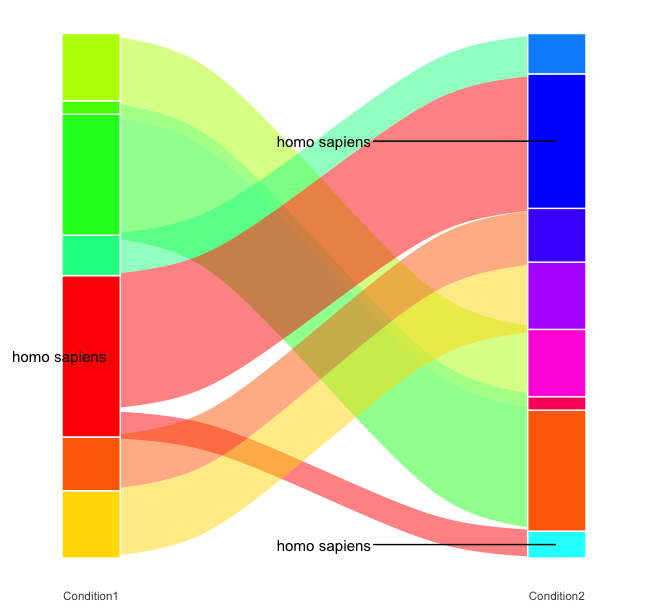
Я хотел бы переместить метки так, чтобы они располагались слева и справа от слоя и не перекрывали сюжет (что особенно раздражает, когда метки длинные). Я видел примеры, в которых для этого используется пакет.
Я пробовал использовать цикл for и
ifelse заявление в звонке
aes в
geom_text_repel(согласно ), но не могу понять код. Может ли кто-нибудь помочь или есть лучшее решение для этого?
Пример неудачного кода с использованием
ggrepel например
      q + ggrepel::geom_text_repel(
    aes(label = ifelse(Condition1 == as.character(res1)[1],as.character(res1)[1], NA)),
        stat = "stratum", size = 4,
        direction = "y", nudge_x = -.5
)
В идеале я хотел бы создать что-то вроде Решению 2 здесьрешения 2 в этом примере от Джейсона Кори Брансона.
      > sessionInfo()
R version 4.0.5 (2021-03-31)
Platform: x86_64-apple-darwin17.0 (64-bit)
Running under: macOS Big Sur 10.16

Matrix products: default
LAPACK: /Library/Frameworks/R.framework/Versions/4.0/Resources/lib/libRlapack.dylib

locale:
[1] en_GB.UTF-8/en_GB.UTF-8/en_GB.UTF-8/C/en_GB.UTF-8/en_GB.UTF-8

attached base packages:
[1] parallel  stats4    stats     graphics  grDevices utils     datasets  methods   base

other attached packages:
 [1] ggalluvial_0.12.3    RColorBrewer_1.1-2   archivist_2.3.6      circlize_0.4.12      dplyr_1.0.5          viridis_0.6.0
 [7] viridisLite_0.4.0    pheatmap_1.0.12      pRolocdata_1.29.1    ggplot2_3.3.3        bandle_1.0           pRoloc_1.30.0
[13] BiocParallel_1.24.1  MLInterfaces_1.70.0  cluster_2.1.1        annotate_1.68.0      XML_3.99-0.6         AnnotationDbi_1.52.0
[19] IRanges_2.24.1       MSnbase_2.16.1       ProtGenerics_1.22.0  mzR_2.24.1           Rcpp_1.0.6           Biobase_2.50.0
[25] S4Vectors_0.28.1     BiocGenerics_0.36.0  BiocStyle_2.18.1
1 ответ
Может быть, это соответствует вашим потребностям. Первый. Поскольку я не так хорошо знаком с
ggalluvialЯ изменил настройку ваших данных, чтобы следовать коду в примере в вашей ссылке, сначала расширив ваш набор данных и преобразовав его в длинный формат. Это позволило мне составить карту на
stratum и
alluvium aes и облегчили кондиционирование вашего
Condition Переменная.
После этого вы можете использовать значение по умолчанию
geom_text для выравнивания этикеток с помощью
ifelse. Или вы можете использовать два
geom_text_repel слои, чтобы разместить метки слева или справа от слоя.
      library(tidyr)
library(dplyr)

df_expanded <- df[rep(row.names(df), df$value), ]
df_expanded <- df_expanded %>%
  mutate(id = row_number()) %>%
  pivot_longer(-c(value, id), names_to = "Condition", values_to = "label")

# plot alluvial diagram
q <- ggplot(df_expanded, aes(x = Condition, stratum = label, alluvium = id, fill = label)) +
  geom_flow(width = 0) +
  scale_fill_manual(values = columnCols) +
  scale_color_manual(values = stratCols) +
  geom_stratum(width = 1 / 8, color = "white") +
  scale_x_discrete(
    expand = c(.25, .25)
  ) +
  scale_y_continuous(breaks = NULL) +
  theme_minimal() +
  theme(
    axis.ticks.y = element_blank(),
    axis.text.y = element_blank(),
    panel.grid.major.y = element_blank(),
    panel.grid.major.x = element_blank()
  ) +
  theme(legend.position = "none") +
  ylab(NULL)

q +
  geom_text(
    aes(
      label = after_stat(stratum),
      hjust = ifelse(Condition == "Condition1", 1, 0),
      x = as.numeric(factor(Condition)) + .075 * ifelse(Condition == "Condition1", -1, 1),
      color = after_stat(stratum)
    ),
    stat = "stratum", fontface = "bold", size = 3
  )
#> Warning: The `.dots` argument of `group_by()` is deprecated as of dplyr 1.0.0.

      q +
  ggrepel::geom_text_repel(
  aes(label = ifelse(after_stat(x) == 1, as.character(after_stat(stratum)), "")),
  stat = "stratum", size = 4, direction = "y", nudge_x = -.6) +
  ggrepel::geom_text_repel(
    aes(label = ifelse(after_stat(x)  == 2, as.character(after_stat(stratum)), "")),
    stat = "stratum", size = 4, direction = "y", nudge_x = .6
  )


