как показать метку данных на гистограмме с помощью chart.js в проекте Angular10?
В проекте Angular я реализую диаграммы, используя chart.js последней версии 2.9.3.
Я реализовал кольцевую диаграмму, гистограмму с накоплением идеально. Теперь мне нужно реализовать гистограмму с накоплением, которая содержит метки данных на оси y.
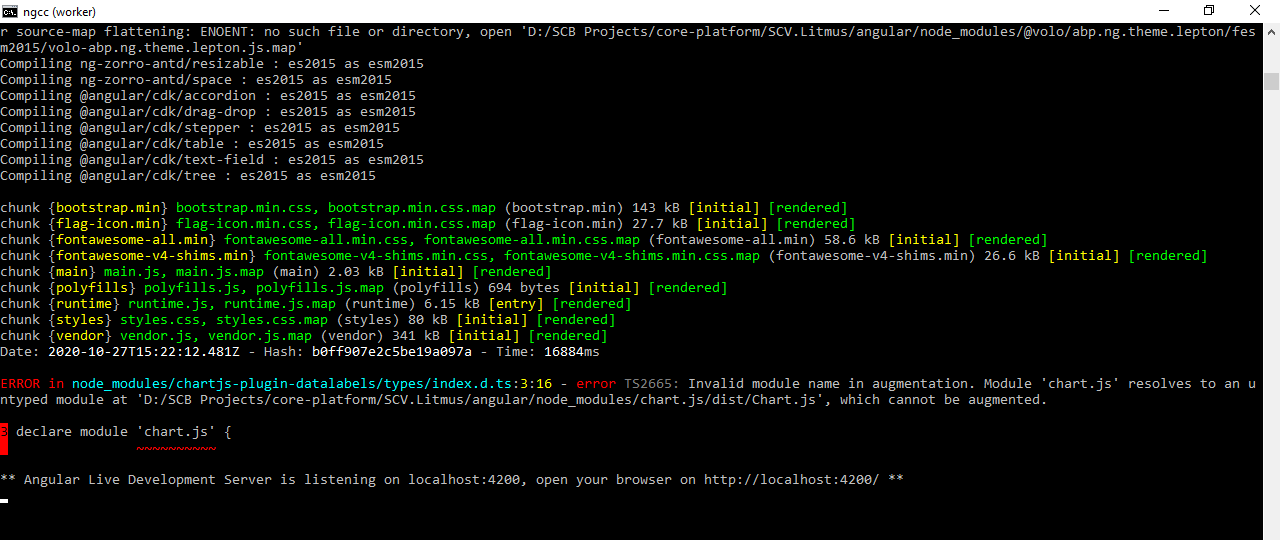
Итак, из документации chart.js с использованием плагина chartjs-plugin-datalabels я попытался отобразить метки здесь, я получил cli errordecalare module chart.js
Чтобы устранить эту ошибку, я установил"@types/chart.js": "^2.9.27", следуя этому решению https://github.com/chartjs/chartjs-plugin-datalabels/pull/121#issuecomment-473327301
теперь в моем package.json
-
 "@types/chart.js": "^2.9.27",
       "chart.js": "^2.9.3",
       "chartjs-plugin-datalabels": "^0.7.0",
Но после установки @types я сталкиваюсь с таким количеством ошибок cli, которых не было до этого
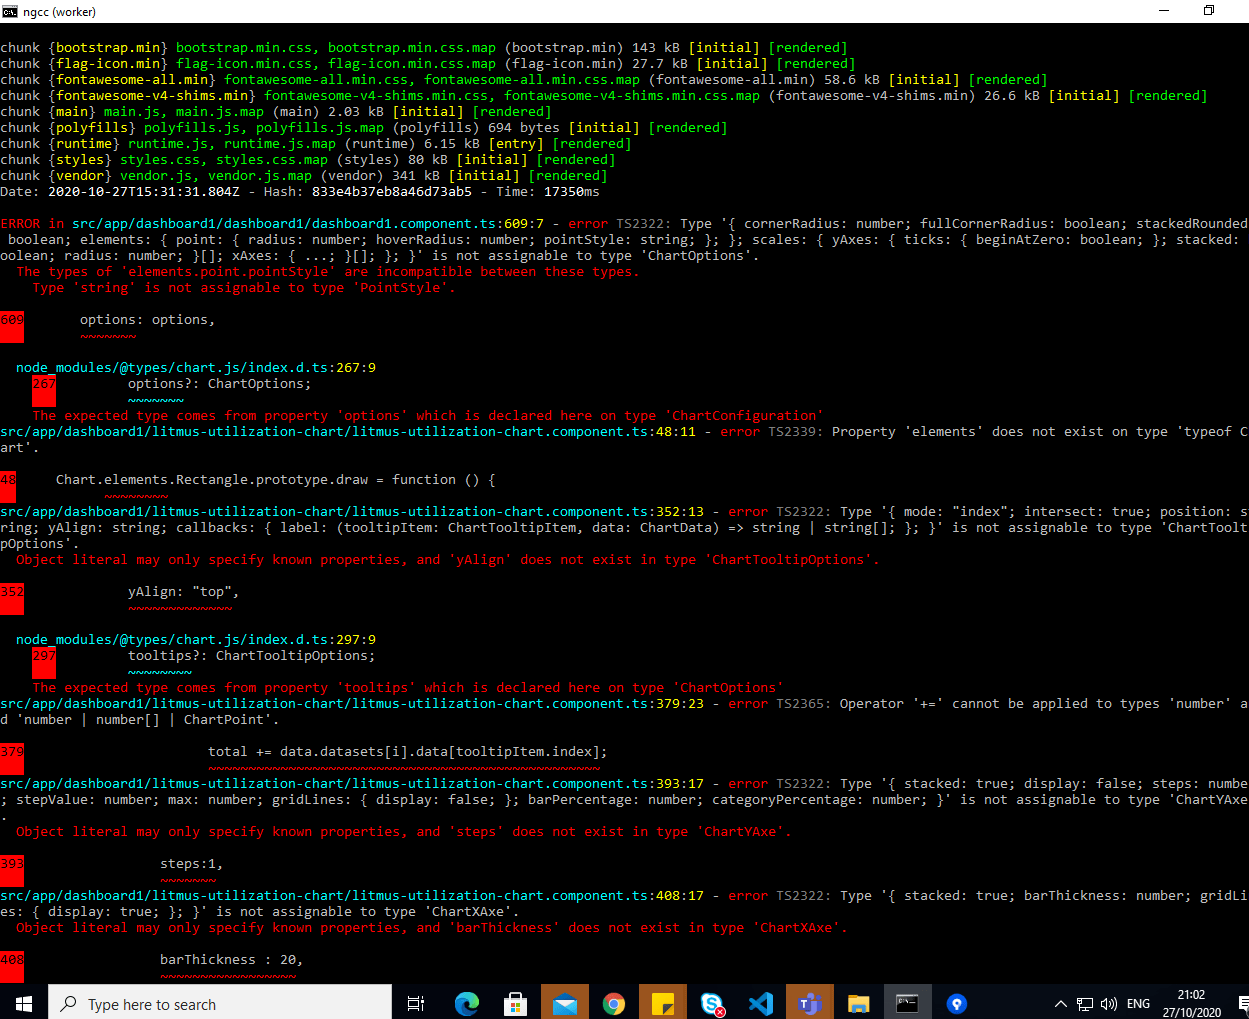
  The types of 'elements.point.pointStyle' are incompatible between these types.
    Type 'string' is not assignable to type 'PointStyle'


  The expected type comes from property 'options' which is declared here on type 'ChartConfiguration'
src/app/dashboard1/litmus-utilization-chart/litmus-utilization-chart.component.ts:48:11 - error TS2339: Property 'elements' does not exist on type 'typeof Chart'.

48     Chart.elements.Rectangle.prototype.draw = function () {


  Object literal may only specify known properties, and 'yAlign' does not exist in type 'ChartTooltipOptions'.

352             yAlign: "top",
            ~~~~~~~~~~~~~
node_modules/@types/chart.js/index.d.ts:297:9 297 всплывающих подсказок?: ChartTooltipOptions;
каковы проблемы, как решить проблему,
Но в проекте stackerzbilz ANgular 10 он работает нормально, не понимая основную причину проблемы https://stackblitz.com/edit/angular-10-base-template-2hul5i
Мой Package.json
    {
  "name": "Litmus",
  "version": "0.0.0",
  "scripts": {
    "ng": "ng",
    "start": "ng serve --open",
    "build": "ng build",
    "build:prod": "ng build --configuration production",
    "test": "jest",
    "lint": "ng lint",
    "e2e": "ng e2e"
  },
  "private": true,
  "jest": {
    "preset": "jest-preset-angular",
    "setupFilesAfterEnv": [
      "<rootDir>/setupJest.ts"
    ],
    "testPathIgnorePatterns": [
      "<rootDir>/node_modules/",
      "<rootDir>/dist/",
      "<rootDir>/src/test.ts"
    ]
  },
  "dependencies": {
    "@angular/animations": "^10.0.11",
    "@angular/cdk": "^10.1.3",
    "@angular/common": "~10.0.1",
    "@angular/compiler": "~10.0.1",
    "@angular/core": "~10.0.1",
    "@angular/forms": "~10.0.1",
    "@angular/material": "^10.1.3",
    "@angular/platform-browser": "~10.0.1",
    "@angular/platform-browser-dynamic": "~10.0.1",
    "@angular/router": "~10.0.1",
    "@volo/abp.ng.account": "~3.0.4",
    "@volo/abp.ng.audit-logging": "~3.0.4",
    "@volo/abp.ng.identity": "~3.0.4",
    "@volo/abp.ng.identity-server": "~3.0.4",
    "@volo/abp.ng.language-management": "~3.0.4",
    "@volo/abp.ng.saas": "~3.0.4",
    "@volo/abp.ng.text-template-management": "~3.0.4",
    "@volo/abp.ng.theme.lepton": "~3.0.4",
    "chart.js": "^2.9.3",
    "chartjs-plugin-datalabels": "^0.7.0",
    "jest": "^26.0.1",
    "jest-preset-angular": "^8.2.1",
    "moment": "^2.29.1",
    "moment-timezone": "^0.5.31",
    "rxjs": "~6.5.4",
    "tslib": "^2.0.0",
    "zone.js": "~0.10.2"
  },
  "devDependencies": {
    "@angular-devkit/build-angular": "~0.1000.0",
    "@angular-devkit/build-ng-packagr": "~0.1000.0",
    "@angular/cli": "~10.0.0",
    "@angular/compiler-cli": "~10.0.1",
    "@angular/language-service": "~10.0.1",
    "@ngxs/logger-plugin": "^3.6.2",
    "@types/jasmine": "~3.5.0",
    "@types/jasminewd2": "~2.0.3",
    "@types/node": "^12.11.1",
    "codelyzer": "^5.1.2",
    "jasmine-core": "~3.5.0",
    "jasmine-spec-reporter": "~5.0.0",
    "karma": "~5.0.0",
    "karma-chrome-launcher": "~3.1.0",
    "karma-coverage-istanbul-reporter": "~3.0.2",
    "karma-jasmine": "~3.3.0",
    "karma-jasmine-html-reporter": "^1.5.0",
    "ng-packagr": "^10.0.0",
    "ngxs-schematic": "^1.1.9",
    "protractor": "~7.0.0",
    "ts-node": "~8.3.0",
    "tslint": "~6.1.0",
    "typescript": "~3.9.5"
  }
}
tsconfig.json
{
  "compileOnSave": false,
  "compilerOptions": {
    "baseUrl": "./",
    "outDir": "./dist/out-tsc",
    "sourceMap": true,
    "declaration": false,
    "downlevelIteration": true,
    "experimentalDecorators": true,
    "module": "esnext",
    "moduleResolution": "node",
    "importHelpers": true,
    "target": "es2015",
    "typeRoots": [
      "node_modules/@types"
    ],
    "lib": [
      "es2018",
      "dom"
    ]
  },
  "angularCompilerOptions": {
    "fullTemplateTypeCheck": true,
    "strictInjectionParameters": true
  }
}
tsconfig.app.json
{
  "extends": "./tsconfig.json",
  "compilerOptions": {
    "outDir": "./out-tsc/app",
    "types": []
  },
  "files": [
    "src/main.ts",
    "src/polyfills.ts"
  ],
  "include": [
    "src/**/*.d.ts"
  ]
}
после добавления "@types/chart.js": "^2.9.27", что приводит к появлению выше изображения ошибки 2, если я не добавил получение изображения ошибки-1
Пожалуйста, дайте любые предложения
заранее спасибо
1 ответ
Пример диаграммы с метками выглядит следующим образом
import { Component } from '@angular/core';

@Component({
  selector: 'app-root',
  templateUrl: './app.component.html',
  styleUrls: ['./app.component.css']
})
export class AppComponent {
  title = 'Bar Chart Example in Angular 4';

  // ADD CHART OPTIONS.
  chartOptions = {
    responsive: true    // THIS WILL MAKE THE CHART RESPONSIVE (VISIBLE IN ANY DEVICE).
  }

  labels =  ['JAN', 'FEB', 'MAR', 'APR', 'MAY', 'JUN', 'JUL', 'AUG', 'SEP', 'OCT', 'NOV', 'DEC'];

  // STATIC DATA FOR THE CHART IN JSON FORMAT.
  chartData = [
    {
      label: '1st Year',
      data: [21, 56, 4, 31, 45, 15, 57, 61, 9, 17, 24, 59]
    },
    {
      label: '2nd Year',
      data: [47, 9, 28, 54, 77, 51, 24]
    }
  ];

  // CHART COLOR.
  colors = [
    { // 1st Year.
      backgroundColor: 'rgba(77,83,96,0.2)'
    },
    { // 2nd Year.
      backgroundColor: 'rgba(30, 169, 224, 0.8)'
    }
  ]

  // CHART CLICK EVENT.
  onChartClick(event) {
    console.log(event);
  }
}