Как установить двухзначные столбцы на графике UWP
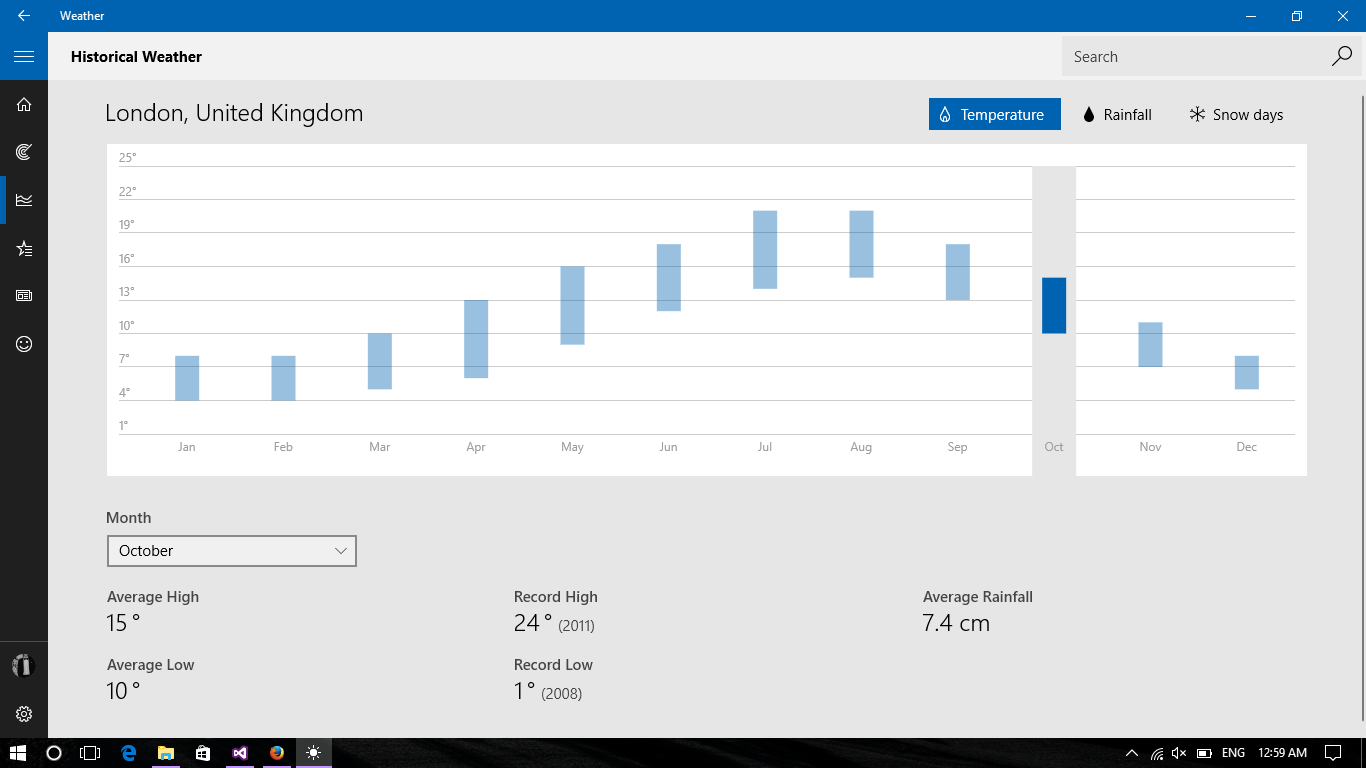
Я использую диаграмму столбцов winrt xaml toolkit и хочу создать диаграмму для градусов, поэтому мне нужно установить минимальное и максимальное значения для каждого имени в списке, и я не смог найти способ для этого. Вот мой код:
Xaml:
<charting:Chart x:Name="chart" FlowDirection="RightToLeft" HorizontalAlignment="Center" Width="800" VerticalAlignment="Top" Height="500" >
     <charting:ColumnSeries Title="month" IndependentValuePath="Name" DependentValuePath="Amount" IsSelectionEnabled="True"/>
 </charting:Chart>
C#
private void LoadChart()
{
    List<weather> list = new List<weather>();
    list.Add(new weather() { Name = "s1", Amount = 5.5 });
    (chart.Series[0] as ColumnSeries).ItemsSource = list;
}
1 ответ
Решение
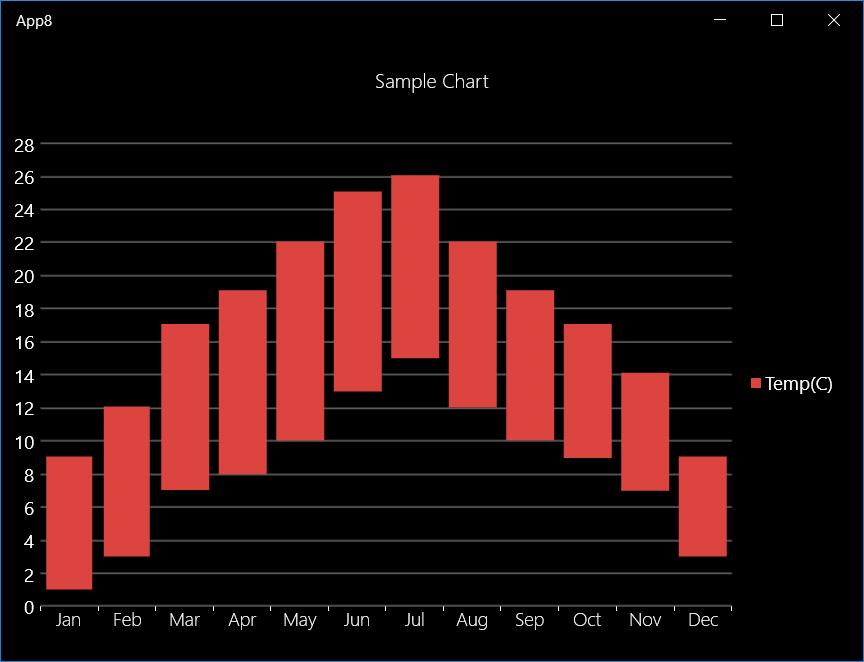
Вот, попробуйте этот пример только для XAML:
XAML:
<Page x:Class="App8.MainPage"
    xmlns="http://schemas.microsoft.com/winfx/2006/xaml/presentation"
    xmlns:x="http://schemas.microsoft.com/winfx/2006/xaml"
    xmlns:chart="using:WinRTXamlToolkit.Controls.DataVisualization.Charting"
    xmlns:local="using:App8"
    xmlns:d="http://schemas.microsoft.com/expression/blend/2008"
    xmlns:mc="http://schemas.openxmlformats.org/markup-compatibility/2006"
    mc:Ignorable="d" Loaded="Page_Loaded">

    <Page.Resources>

        <local:WeatherCollection x:Key="data1">
            <local:Weather Month="Jan" MinAmount="1" MaxAmount="8"/>
            <local:Weather Month="Feb" MinAmount="3" MaxAmount="9"/>
            <local:Weather Month="Mar" MinAmount="7" MaxAmount="10"/>
            <local:Weather Month="Apr" MinAmount="8" MaxAmount="11"/>
            <local:Weather Month="May" MinAmount="10" MaxAmount="12"/>
            <local:Weather Month="Jun" MinAmount="13" MaxAmount="12"/>
            <local:Weather Month="Jul" MinAmount="15" MaxAmount="11"/>
            <local:Weather Month="Aug" MinAmount="12" MaxAmount="10"/>
            <local:Weather Month="Sep" MinAmount="10" MaxAmount="9"/>
            <local:Weather Month="Oct" MinAmount="9" MaxAmount="8"/>
            <local:Weather Month="Nov" MinAmount="7" MaxAmount="7"/>
            <local:Weather Month="Dec" MinAmount="3" MaxAmount="6"/>
        </local:WeatherCollection>

        <Style x:Key="Style1" TargetType="chart:ColumnDataPoint">
            <Setter Property="Background" Value="Transparent"/>
        </Style>

    </Page.Resources>

    <Grid Background="{ThemeResource ApplicationPageBackgroundThemeBrush}">

        <chart:Chart Title="Sample Chart">
            <chart:StackedColumnSeries>
                <chart:SeriesDefinition ItemsSource="{StaticResource data1}"
                                        DependentValuePath="MinAmount"
                                        DataPointStyle="{StaticResource Style1}"
                                        IndependentValuePath="Month"/>
                <chart:SeriesDefinition ItemsSource="{StaticResource data1}"
                                        DependentValuePath="MaxAmount"
                                        IndependentValuePath="Month"
                                        Title="Temp(C)"/>
            </chart:StackedColumnSeries>
        </chart:Chart>

    </Grid>
</Page>
Модель / ViewModel:
public class WeatherCollection : ObservableCollection<Weather>
{
}
public class Weather
{
    public string Month { get; set; }
    public double MaxAmount { get; set; }
    public double MinAmount { get; set; }
}

