Рисуем очень длинную легенду внизу scatterplot3d
Как я могу правильно разместить очень длинную легенду внизу графика scatterplot3d? Я пробовал использовать layout, oma, mar, но не мог понять. Я хочу, чтобы сюжет был вверху, а легенду - внизу. Я не могу продолжить. Мне очень нужна помощь:(
Вот код, который я пробовал до сих пор:
       library("scatterplot3d")


mean_E = c(2.5459233083,-1.75924812,-1.48706767,-1.70857143,-1.7201293233,2.1565954887,-1.3398496,3.353383,-0.96511278,2.81007519,0.8252120301,0.7203008,-1.2539834586,-1.5503759,0.67669,-0.0421053)
mean_P = c(1.02256,-1.744361,-1.56391,0.390977,-0.9819549,1.76015038,-1.962406,2.6294015038,0.526316,2.9744361,0.9172932,0.6315789,-0.6210526,0.93985,1.4208105263,0.406015)
mean_A = c(0.09023,-0.5714,-0.6165414,-0.428571,0.225564,0.80766917,-0.64180451,1.6967218045,-0.030075,2.6631579,0.5714286,0.1609023,-0.7487218,0.3619112782,1.7578947,0.3729323)
statementNameList = c("Sentence Sentence Sentence Sentence Sentence Sentence 1",
"Sentence Sentence Sentence Sentence Sentence Sentence 2",
"Sentence Sentence Sentence Sentence Sentence Sentence 3",
"Sentence Sentence Sentence Sentence Sentence Sentence 4",
"Sentence Sentence Sentence Sentence Sentence Sentence 5",
"Sentence Sentence Sentence Sentence Sentence Sentence 6",
"Sentence Sentence Sentence Sentence Sentence Sentence 7",
"Sentence Sentence Sentence Sentence Sentence Sentence 8",
"Sentence Sentence Sentence Sentence Sentence Sentence 9",
"Sentence Sentence Sentence Sentence Sentence Sentence 10",
"Sentence Sentence Sentence Sentence Sentence Sentence 11",
"Sentence Sentence Sentence Sentence Sentence Sentence 12",
"Sentence Sentence Sentence Sentence Sentence Sentence 13",
"Sentence Sentence Sentence Sentence Sentence Sentence 14",
"Sentence Sentence Sentence Sentence Sentence Sentence 15",
"Sentence Sentence Sentence Sentence Sentence Sentence 16")

mean_df <- data.frame("E"=mean_E,"P"=mean_P,"A"=mean_A,"Sentence"=statementNameList)

expressions <- data.frame("E"=c(-1.569,1.4796,-2.3793,3.4469,-2.4077, 2.8125,-2.5706,  3.0389,-2.09,-2.2676, -2.0267),
                          "P"=c(-1.1345,1.3151,-1.3414,2.9125,-0.7577, 2.2475,0.2676, 1.8417,-0.7833, -0.3514, 1.0667 ),
                          "A"=c(-2.0621,2.3139,-1.8759,0.2438,-0.6808, 2.16,0.4265, -2.7889,-2.19,0.7243,1.7967),
                          "Emotion"= c("Tired", "Surprised", "Sad", "Happy", "Fearful", "Excited", "Disgusted", "Calm", "Bored", "Annoyed", "Angry") )


title="EPA Ratings"
xlabel = "Evaluation (E)"
ylabel = "Potency (P)"
zlabel = "Activitiy (A)"
angle = -70


plot<-scatterplot3d(expressions$E ,expressions$P,expressions$A, main=title,
                    xlab=xlabel, ylab=ylabel, zlab=zlabel, pch = "", grid=TRUE, box=TRUE,
                    angle = angle)
plot$points3d(expressions$E ,expressions$P,expressions$A, pch = 5, col="red")

color_palette = grDevices::colors()[grep('gr(a|e)y', grDevices::colors(), invert = T)]
# select different color for each sentence
colors =sample(color_palette, 16)
plot$points3d(mean_df$E ,mean_df$P,mean_df$A, pch = 16, col=colors, cex=2)

legend(3,-3, legend = statementNameList,col = colors, pch = 16, inset = -0.5, cex = 0.7,
        bty = "n",xpd = TRUE)

text(plot$xyz.convert(expressions$E ,expressions$P,expressions$A-0.2), labels = expressions$Emotion, col = "darkblue", cex=0.6)
Вот текущий вывод, который у меня есть: 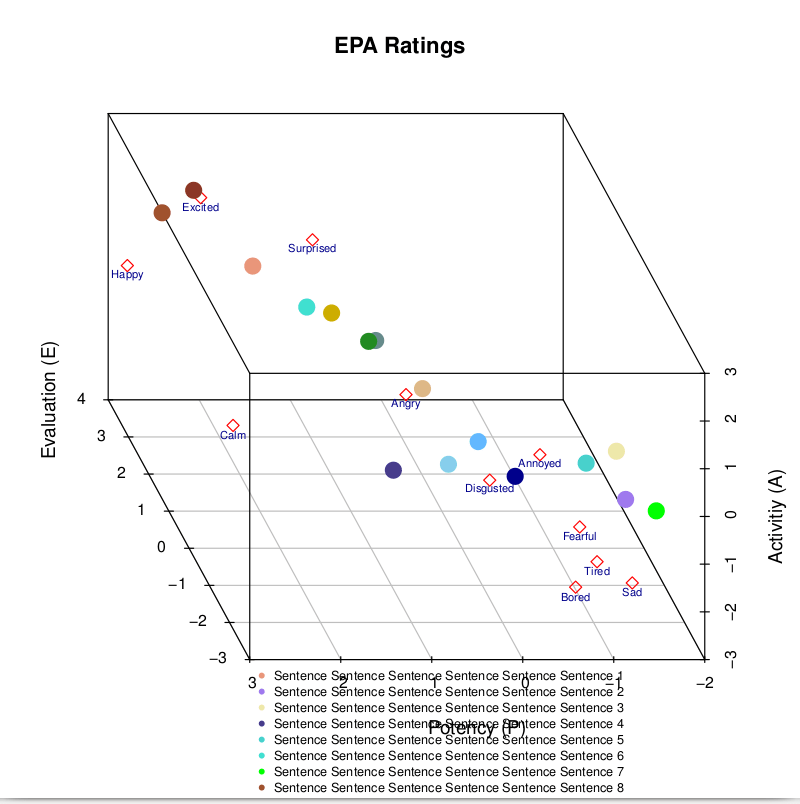
1 ответ
Может быть, вы можете попробовать следующий код. Я нашел это по этой ссылке. http://www.sthda.com/english/wiki/scatterplot3d-3d-graphics-r-software-and-data-visualization
Пользовательские формы / цвета
s3d <- scatterplot3d(iris[,1:3], pch = shapes, color=colors)
legend("bottom", legend = levels(iris$Species),
      col =  c("#999999", "#E69F00", "#56B4E9"),
      pch = c(16, 17, 18),
      inset = -0.25, xpd = TRUE, horiz = TRUE)