ChartJS - Пользовательский размер сегмента пончика
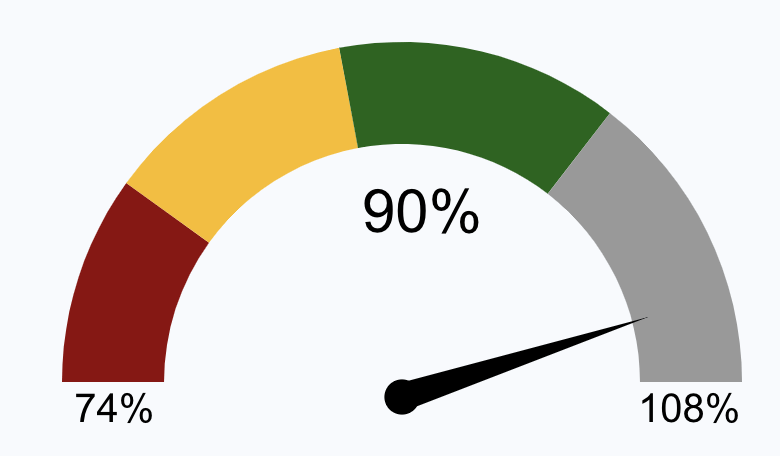
Я создаю компонент React, который генерирует спидометр, и я хочу установить длину каждого сегмента (т.е. красный - 30%, желтый - 30%, зеленый - 30% и серый - 10%).
Я использую React-ChartJS-2 и onComplete анимации, я рисую текст и иглу.
Я проверил документацию, и нет ничего, чтобы установить длину или ширину каждого сегмента. В идеальной ситуации стрелка была бы в зеленой зоне... и да, наши числа учитывают 100+%
У кого-нибудь есть идея, как это сделать, либо плагин, либо функция обратного вызова, к которой я могу привязаться, которая позволяет мне настраивать, как отрисовывается каждый сегмент?
           <Box>
      <Box style={{ position: 'relative', paddingLeft: theme.spacing(1.25), height: 300 }}>
        <Doughnut
          ref={chartRef}
          data={{
            labels: labels ?? data,
            datasets: [
              {
                data: data,
                // Use backgroundColor if available or generate colors based on number of data points
                backgroundColor: backgroundColor ?? generateColorArray(20, 360, data.length),
                borderWidth: 0
              }
            ]
          }}
          options={{
            legend: {
              display: false,
              position: 'top',
              fullWidth: true
            },
            layout: {
              padding: {
                top: 50,
                left: 25,
                right: 25,
                bottom: 25
              }
            },
            rotation: 1 * Math.PI,
            circumference: Math.PI,
            cutoutPercentage: 70,
            animation: {
              duration: 500,
              easing: 'easeOutQuart',
              onComplete: function(e): void {
                drawNeedle(e.chart.innerRadius, e.chart.outerRadius);
                drawText(`${needleValue.toString()}%`, e.chart.innerRadius, e.chart.outerRadius);
              },
              onProgress: function(e): void {
                console.log('e: ', e);
              }
            },
            tooltips: {
              enabled: false
            },
            // Disable other events from firing which causes the chart elements to get pushed down onHover
            events: []
          }}
        />
      </Box>
    </Box>
       const drawNeedle = (innerRadius: number, outerRadius: number): void => {
    const chart = chartRef.current as Doughnut;
    const ctx = chart.chartInstance.ctx;
    const maxValue = 180;

    if (ctx) {
      const rotation = -Math.PI;
      const circumference = Math.PI;
      const origin = rotation + circumference * (0 / maxValue);
      const target = rotation + circumference * (((needleValue / 100) * 180) / maxValue);
      const angle = origin + (target - origin) * 1;
      const chartArea = chart.chartInstance.chartArea;
      const width = chartArea.right - chartArea.left;
      const needleRadius = (2 / 100) * width;
      const needleWidth = (3.2 / 100) * width;
      const needleLength = (20 / 100) * (outerRadius - innerRadius) + innerRadius;

      const cw = ctx.canvas.offsetWidth;
      const ch = ctx.canvas.offsetHeight;
      const cx = cw / 2;
      const cy = ch - ch / 14;

      ctx.save();
      ctx.translate(cx, cy);
      ctx.rotate(angle);
      ctx.fillStyle = 'rgba(0, 0, 0, 1)';

      // draw circle
      ctx.beginPath();
      ctx.ellipse(0, 0, needleRadius, needleRadius, 0, 0, 2 * Math.PI);
      ctx.fill();

      // draw needle
      ctx.beginPath();
      ctx.moveTo(0, needleWidth / 2);
      ctx.lineTo(needleLength, 0);
      ctx.lineTo(0, -needleWidth / 2);
      ctx.fill();

      ctx.restore();
    }
  };

  const drawText = (text: string, innerRadius: number, outerRadius: number): void => {
    const chart = chartRef.current as Doughnut;
    const ctx = chart.chartInstance.ctx;
    const minValue = Math.min(...data);
    const maxValue = Math.max(...data);

    if (ctx) {
      ctx.fillStyle = 'rgba(0, 0, 0, 1)';

      const chartArea = chart.chartInstance.chartArea;
      const centerX = (chartArea.left + chartArea.right) / 2;
      const centerY = (chartArea.top + chartArea.bottom) / 2;
      const textMetrics = ctx.measureText(text);
      const textHeight = Math.max(ctx.measureText('m').width, ctx.measureText('\uFF37').width);

      const radialDiff = outerRadius - innerRadius;

      // Min / Max values
      ctx.font = '20px Arial';
      ctx.fillText(`${minValue}%`, chartArea.left + radialDiff * 1.1, chartArea.bottom + textHeight * 2);
      ctx.fillText(`${maxValue}%`, chartArea.right - radialDiff * 2, chartArea.bottom + textHeight * 2);

      // Needle value
      ctx.font = '30px Arial';
      ctx.fillText(text, centerX - textMetrics.width, centerY + textHeight);
    }
  };