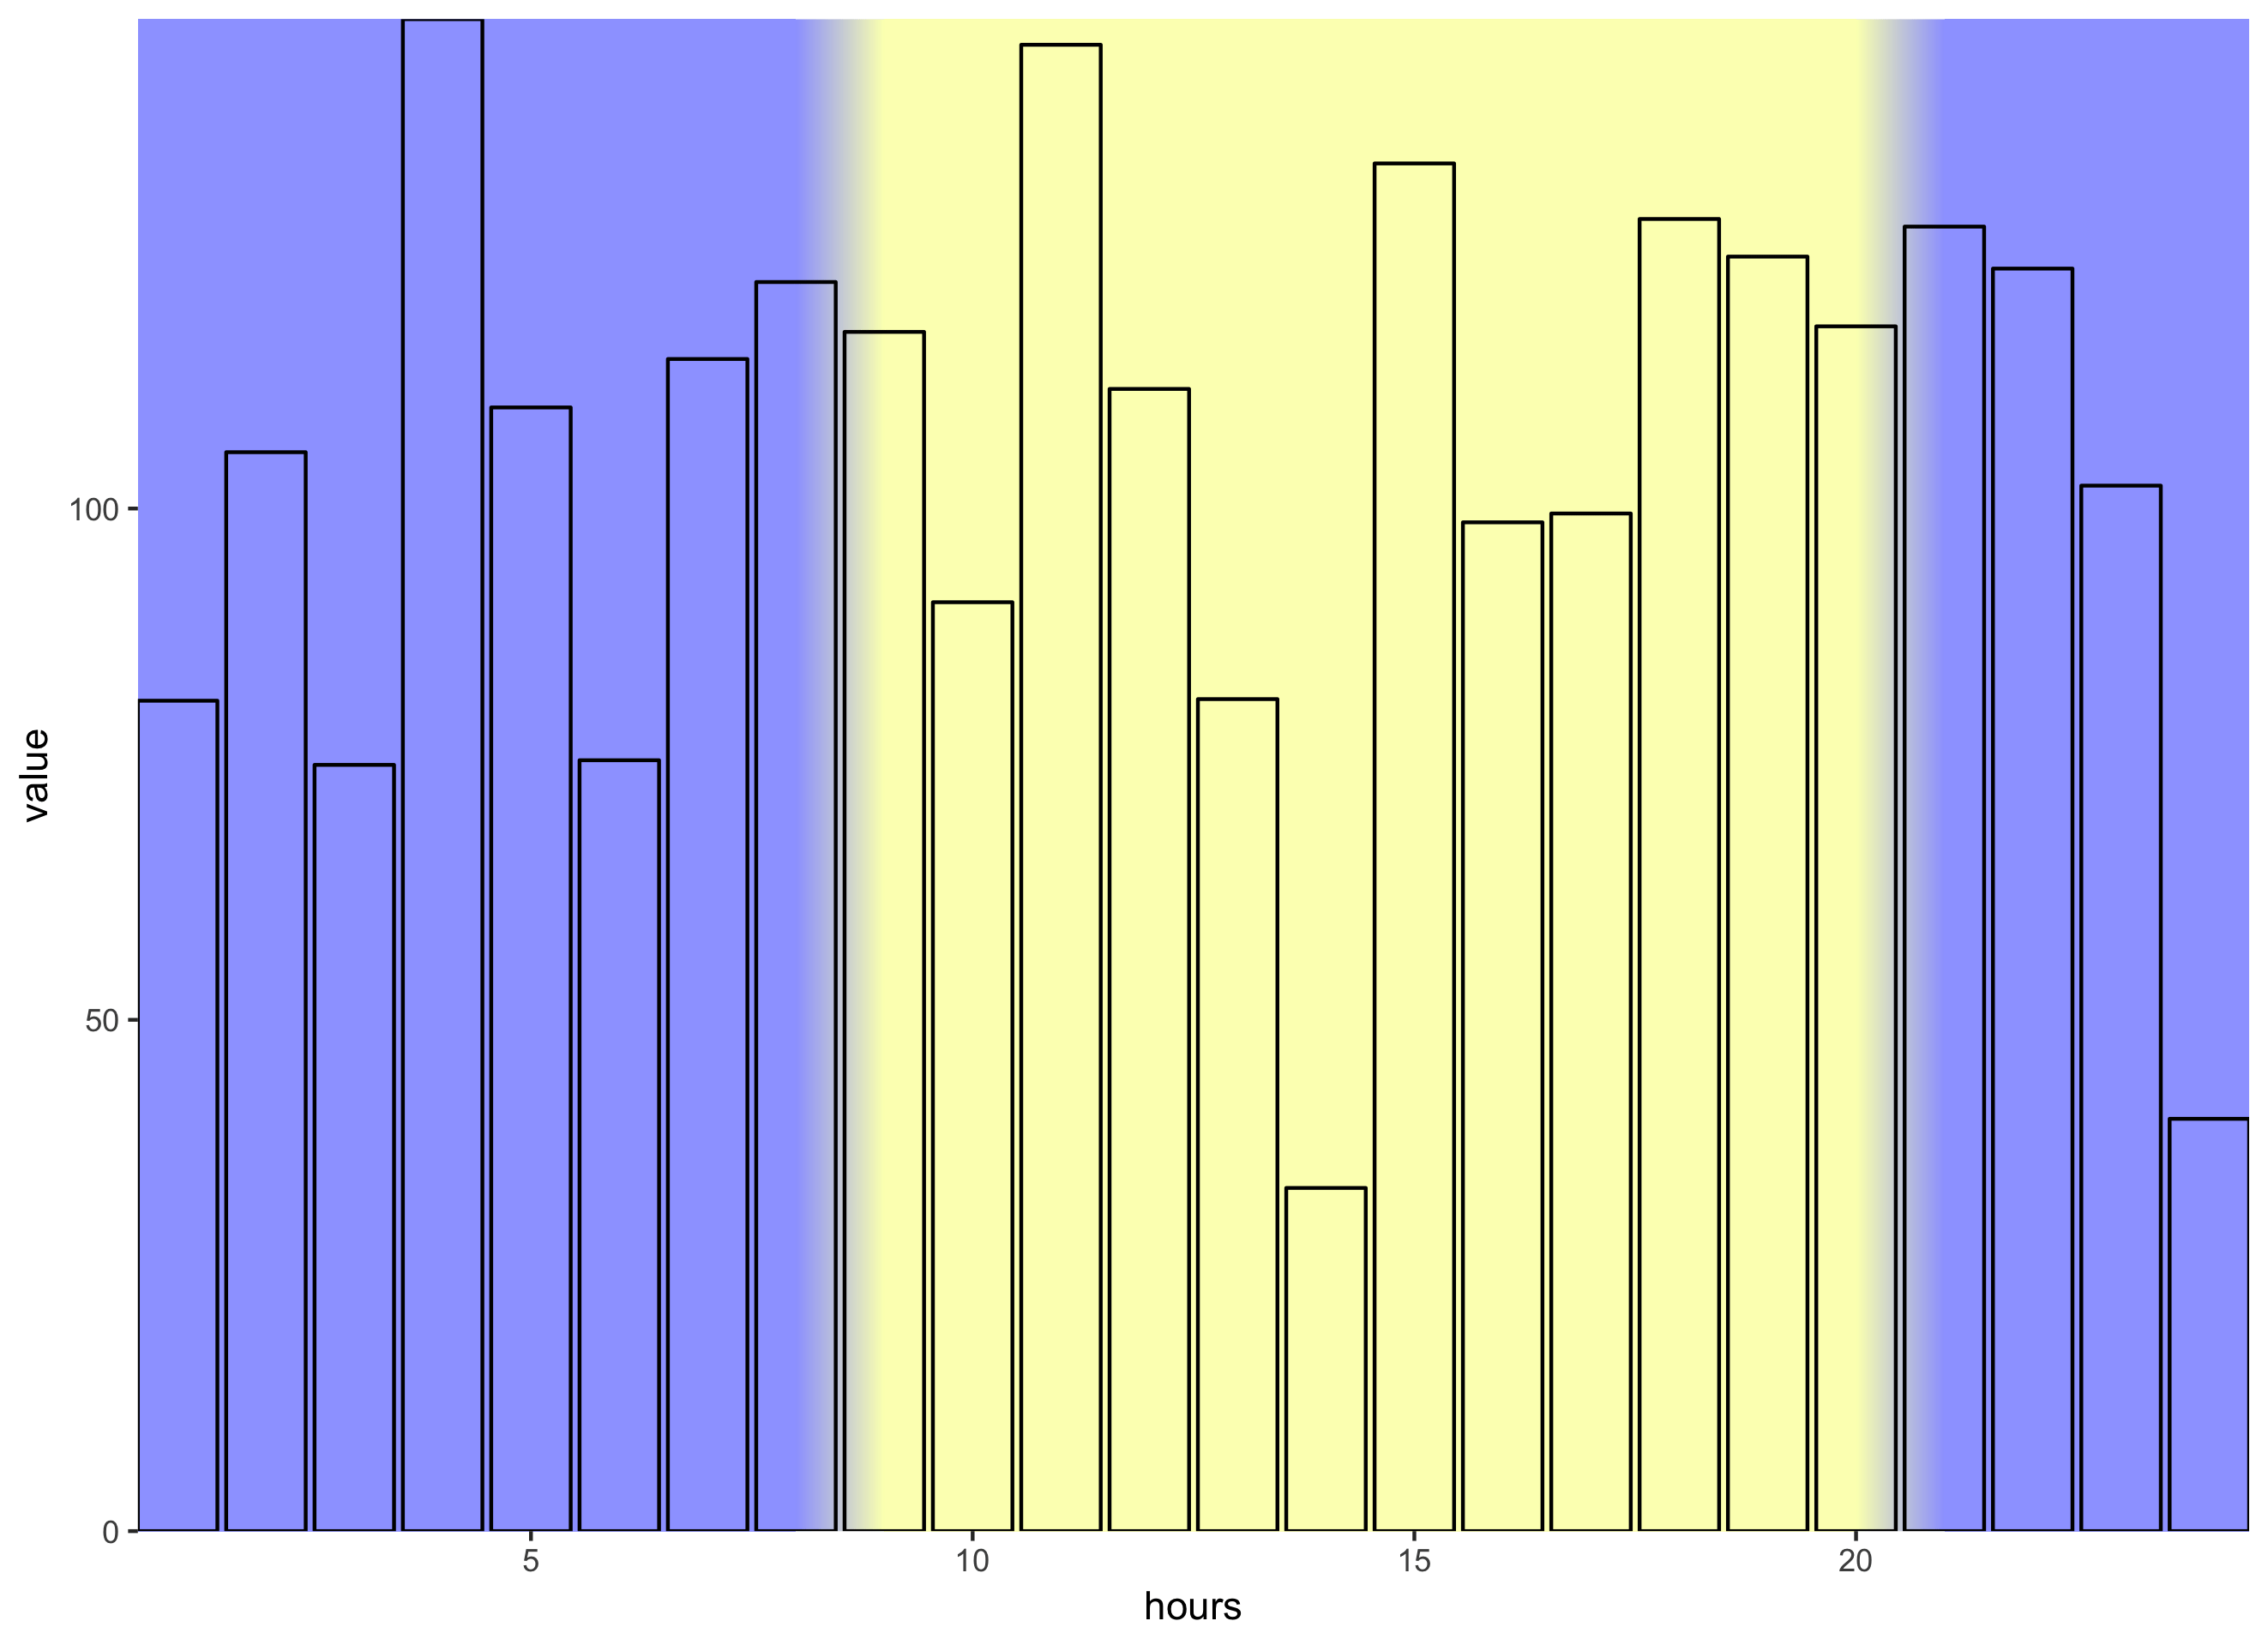
Горизонтальный градиент с растром Grob R для фона ggplot2
Я пытаюсь добавить фон к графику, чтобы показать условия освещения в течение 24-часового периода (т.е. ночью, восходом солнца, днем, закатом). Я хотел бы использовать градиент для обозначения периодов светового перехода (8 утра-9 утра для восхода солнца и 8 вечера-9 вечера для заката) и сплошные цвета для дня и ночи.
Я очень близко, однако градиенты находятся в вертикальной ориентации, и мне нужно это горизонтально.
Любая помощь приветствуется!
Текущий рабочий код
library(ggplot2)
library(scales)

## date, start and stop time

datestart <- as.POSIXct(strptime('2017-06-20 00:00:00', format = "%Y-%m-%d %H:%M:%S"))
datestop <- as.POSIXct(strptime('2017-06-20 23:59:59', format = "%Y-%m-%d %H:%M:%S"))

## sunrise

risestart <- as.POSIXct(strptime('2017-06-20 08:00:00', format = "%Y-%m-%d %H:%M:%S"))
risestop <- as.POSIXct(strptime('2017-06-20 09:00:00', format = "%Y-%m-%d %H:%M:%S"))

## sunset

setstart <- as.POSIXct(strptime('2017-06-20 20:00:00', format = "%Y-%m-%d %H:%M:%S"))
setstop <- as.POSIXct(strptime('2017-06-20 21:00:00', format = "%Y-%m-%d %H:%M:%S"))

## data limits

lims <- c(datestart, datestop)

## generate some random data

timelist <- seq(datestart, datestop, by = '15 mins')
act <- runif(length(timelist), min = 0, max = 50)

data <- data.frame(timelist, act)

## colours

nightColour <- c("#9ea5ff")
sunriseColour <- c("#9ea5ff", "#fcffbd")
testColour <- c(c("#9ea5ff"), c("#fcffbd"))

dayColour <- c("#fcffbd")
sunsetColour <- c("#fcffbd","#9ea5ff")

## add background

nightGrob <- rasterGrob(nightColour, width = unit(1,"npc"), height = unit(1,"npc"),
                        interpolate = TRUE)

sunriseGrob <- rasterGrob(sunriseColour, width = unit(1,"npc"), height = unit(1,"npc"),
                          interpolate = TRUE)

dayGrob <- rasterGrob(dayColour, width = unit(1,"npc"), height = unit(1,"npc"),
                      interpolate = TRUE)

sunsetGrob <- rasterGrob(sunsetColour, width = unit(1,"npc"), height = unit(1,"npc"),
                         interpolate = TRUE)

## plot

ggplot(data = data, aes(x = timelist, y = act)) +
  annotation_custom(nightGrob, xmin = as.numeric(datestart), xmax = as.numeric(risestart) + 100, ymin = -Inf, ymax = Inf) +
  annotation_custom(sunriseGrob, xmin = as.numeric(risestart), xmax = as.numeric(risestop), ymin = -Inf, ymax = Inf) +
  annotation_custom(dayGrob, xmin = as.numeric(risestop), xmax = as.numeric(setstart), ymin = -Inf, ymax = Inf) +
  annotation_custom(sunsetGrob, xmin = as.numeric(setstart), xmax = as.numeric(setstop), ymin = -Inf, ymax = Inf) +
  annotation_custom(nightGrob, xmin = as.numeric(setstop), xmax = as.numeric(datestop), ymin = -Inf, ymax = Inf) +
  geom_bar(stat = "identity", colour = "black", fill = "white") +
  scale_x_datetime(limits = lims, expand = c(0,0), breaks = date_breaks('1 hour'), labels = date_format(format = "%H", tz = "Europe/London")) +
  scale_y_continuous(expand = c(0,0))
1 ответ
Вы также можете сделать градиент с большим количеством geom_rectс вместо rasterGrob если хочешь.
Вот функция, которая возвращает data.frame данных графика для градиентных фонов, которые вы можете построить geom_rect,
GenerateGradientData <- function(start_hour,
                                 stop_hour,
                                 start_colour,
                                 stop_colour,
                                 x_resolution = 100) {

    # define the colour palette
    colour_function <- colorRampPalette(
        c(start_colour, stop_colour),
        alpha = TRUE)

    # set up the rect coordinates
    x_range <- seq(start_hour,
                      stop_hour,
                      length.out = x_resolution + 1)
    grad_xmin <- x_range[-length(x_range)]
    grad_xmax <- x_range[c(1:x_resolution + 1)]

    # define colours
    grad_colours <- colour_function(x_resolution)

    # return data.frame
    data.frame(
        xmin = grad_xmin,
        xmax = grad_xmax,
        ymin = -Inf,
        ymax = Inf,
        grad_colours = grad_colours
    )
}
Вот пример с использованием числовой оси X:
# dummy data
set.seed(1)
plot_data <- data.frame(
    hours = c(1:24),
    value = rnorm(24, 100, 30)
)

# day/night colours
night_colour <- c("#9ea5ff")
day_colour <- c("#fcffbd")

# generate data for a one-hour sunrise gradient
sunrise_pd <- GenerateGradientData(start_hour = 8,
                                   stop_hour = 9,
                                   start_colour = night_colour,
                                   stop_colour = day_colour,
                                   x_resolution = 1000)

# generate data for a one-hour sunset gradient
sunset_pd <- GenerateGradientData(start_hour = 20,
                                  stop_hour = 21,
                                  start_colour = day_colour,
                                  stop_colour = night_colour,
                                  x_resolution = 1000)

# setup plot
ggplot(plot_data, aes(x = hours, y = value)) +
    scale_x_continuous(expand = c(0, 0)) +
    scale_y_continuous(expand = c(0, 0)) +

    # day background
    geom_rect(xmin = 9,
              xmax = 20,
              ymin = -Inf,
              ymax = Inf,
              fill = day_colour) +

    # night background
    geom_rect(xmin = -Inf,
              xmax = 8,
              ymin = -Inf,
              ymax = Inf,
              fill = night_colour) +
    geom_rect(xmin = 21,
              xmax = Inf,
              ymin = -Inf,
              ymax = Inf,
              fill = night_colour) +

    # gradient backgrounds for sunrise and sunset
    geom_rect(data = sunrise_pd,
              mapping = aes(xmax = xmax,
                            xmin = xmin,
                            ymax = ymax,
                            ymin = ymin),
              fill = sunrise_pd$grad_colours,
              inherit.aes = FALSE) +
    geom_rect(data = sunset_pd,
              mapping = aes(xmax = xmax,
                            xmin = xmin,
                            ymax = ymax,
                            ymin = ymin),
              fill = sunset_pd$grad_colours,
              inherit.aes = FALSE) +

    # finally, plot your data on top
    geom_col(fill = NA, colour = "black")
Вот вывод:
Это может выглядеть немного блочно в зависимости от x_resolution, графическое устройство, которое вы сохраняете, и средство просмотра изображений.
