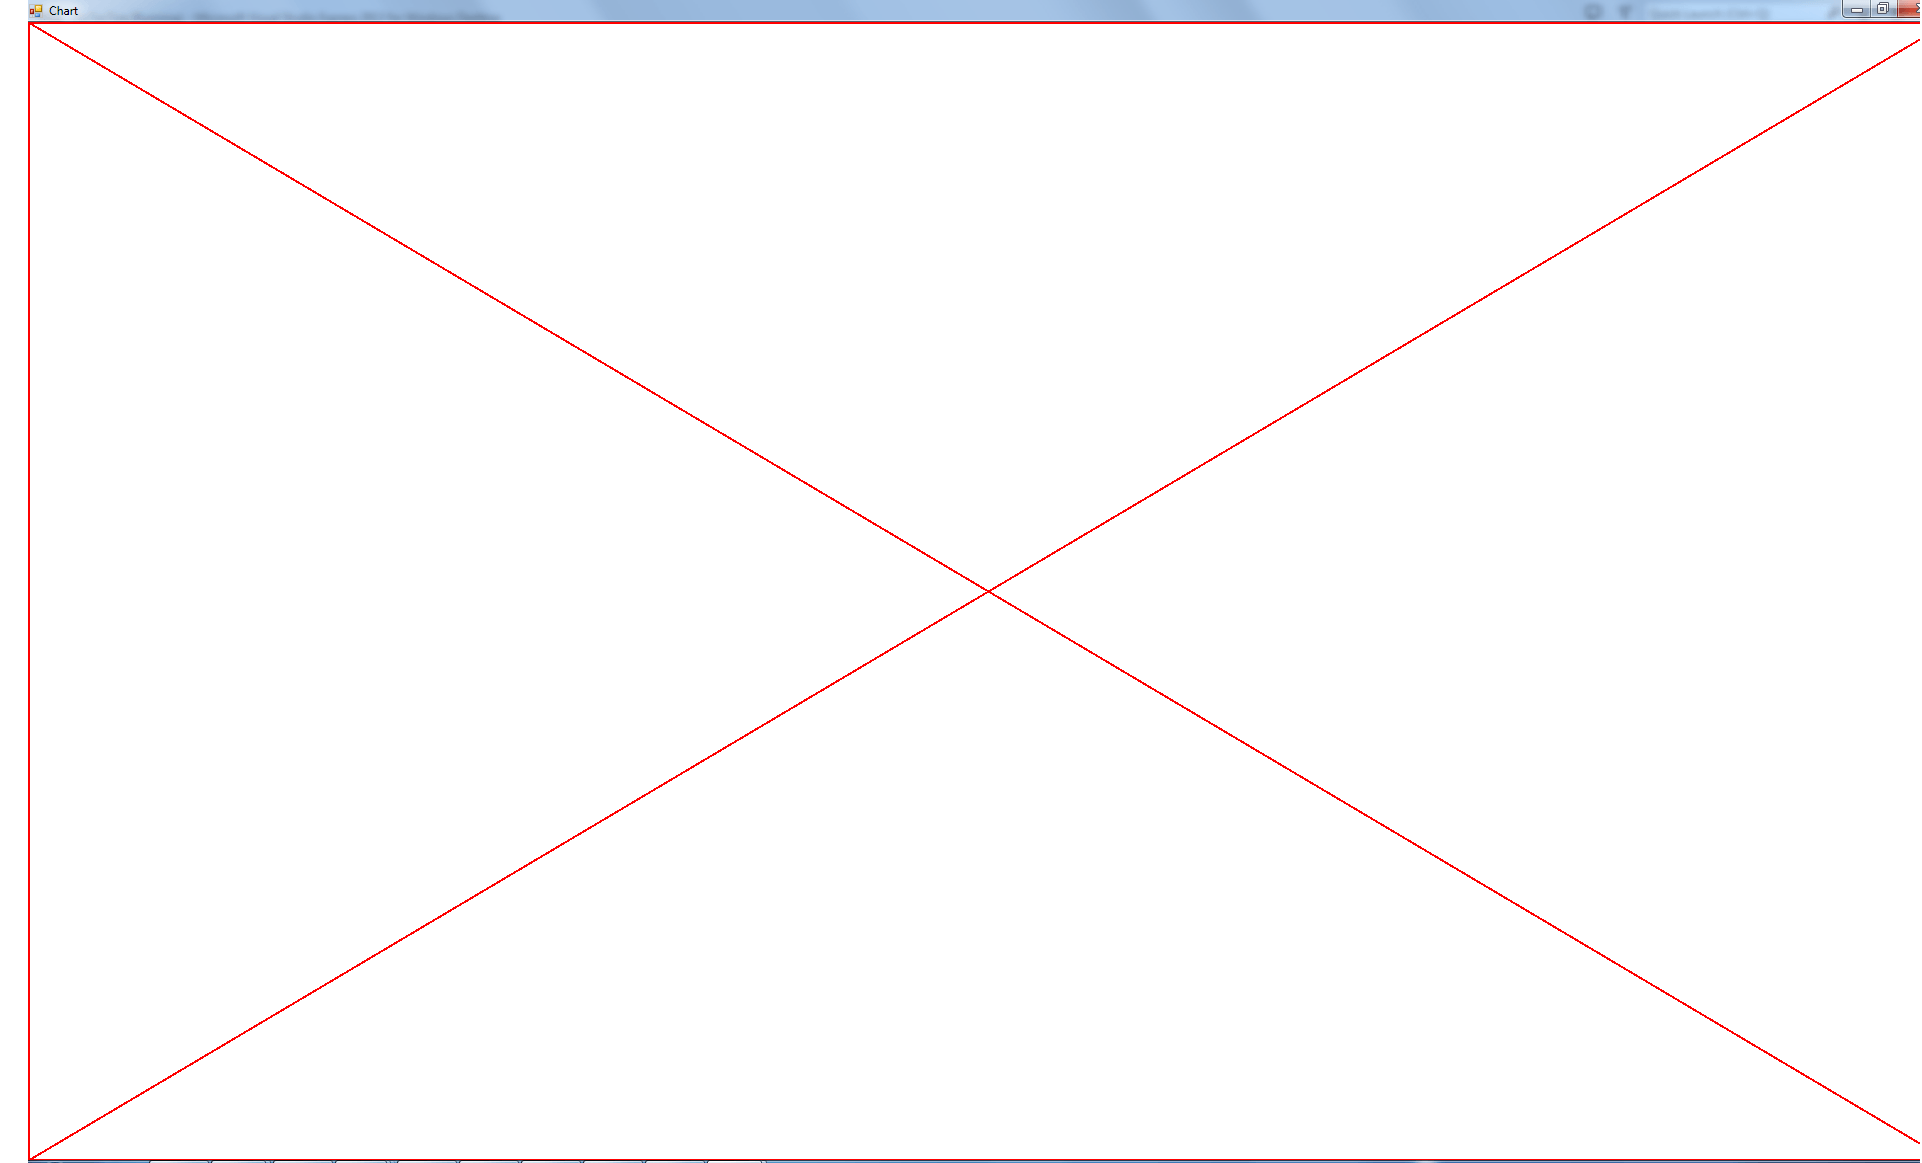
"Red X of Doom" при построении графика нескольких временных рядов в WinForm
Я пытаюсь построить данные нескольких временных рядов. Я основал свой код на принятом ответе здесь:
Диаграмма создается динамически. в.net, C#
Тем не менее, я строю данные для нескольких временных рядов, которые могут поступать из разных источников, которые я пометил как "теги".
После двух звонков в AddXY из разных источников я получаю большой Red X, но не могу понять, почему это так. Мой код ниже, вместе с изображением большого красного X, на случай, если я буду говорить неоднозначно.
Возможно, стоит отметить, что я нахожусь в консольном приложении и создаю WinForm динамически.
using System;
using System.Collections.Concurrent;
using System.Collections.Generic;
using System.Linq;
using System.Runtime.CompilerServices;
using System.Text;
using System.Threading.Tasks;
using System.Windows.Forms;
using System.Windows.Forms.DataVisualization;
using System.Windows.Forms.DataVisualization.Charting;

namespace MyApplication
{
    public class ChartForm : Form
    {
        private System.ComponentModel.IContainer components = null;
        System.Windows.Forms.DataVisualization.Charting.Chart chart1;
        System.Windows.Forms.DataVisualization.Charting.Series series1;
        ConcurrentDictionary<string, System.Windows.Forms.DataVisualization.Charting.Series> tagToSeriesDict;
        Random r = new Random();

        public ChartForm()
        {
            InitializeComponent();

        }
        private void Form1_Load(object sender, EventArgs e)
        {
            this.tagToSeriesDict = new ConcurrentDictionary<string, System.Windows.Forms.DataVisualization.Charting.Series>();
            chart1.Series.Clear();
        }

        [MethodImpl(MethodImplOptions.Synchronized)]
        public void addPoint(string tag, double x, double y)
        {
            if (!tagToSeriesDict.ContainsKey(tag))
            {
                tagToSeriesDict[tag] = new System.Windows.Forms.DataVisualization.Charting.Series
                {
                    Name = tag,
                    Color = System.Drawing.Color.FromArgb((int)(r.NextDouble() * 255), (int)(r.NextDouble() * 255), (int)(r.NextDouble() * 255)),
                    IsVisibleInLegend = false,
                    IsXValueIndexed = true,
                    ChartType = SeriesChartType.Line
                };

                this.chart1.Series.Add(tagToSeriesDict[tag]);
            }

            tagToSeriesDict[tag].Points.AddXY(x, y);
        }

        protected override void Dispose(bool disposing)
        {
            if (disposing && (components != null))
            {
                components.Dispose();
            }
            base.Dispose(disposing);
        }

        private void InitializeComponent()
        {
            this.components = new System.ComponentModel.Container();
            System.Windows.Forms.DataVisualization.Charting.ChartArea chartArea1 = new System.Windows.Forms.DataVisualization.Charting.ChartArea();
            System.Windows.Forms.DataVisualization.Charting.Legend legend1 = new System.Windows.Forms.DataVisualization.Charting.Legend();
            this.chart1 = new System.Windows.Forms.DataVisualization.Charting.Chart();
            ((System.ComponentModel.ISupportInitialize)(this.chart1)).BeginInit();
            this.SuspendLayout();
            //
            // chart1
            //
            chartArea1.Name = "ChartArea1";
            this.chart1.ChartAreas.Add(chartArea1);
            this.chart1.Dock = System.Windows.Forms.DockStyle.Fill;
            legend1.Name = "Legend1";
            this.chart1.Legends.Add(legend1);
            this.chart1.Location = new System.Drawing.Point(0, 50);
            this.chart1.Name = "chart1";
            // this.chart1.Size = new System.Drawing.Size(284, 212);
            this.chart1.TabIndex = 0;
            this.chart1.Text = "chart1";
            //
            // Form1
            //
            this.AutoScaleDimensions = new System.Drawing.SizeF(6F, 13F);
            this.AutoScaleMode = System.Windows.Forms.AutoScaleMode.Font;
            this.ClientSize = new System.Drawing.Size(800, 600);
            this.Controls.Add(this.chart1);
            this.Name = "Form1";
            this.Text = "Chart";
            this.Load += new System.EventHandler(this.Form1_Load);
            ((System.ComponentModel.ISupportInitialize)(this.chart1)).EndInit();
            this.ResumeLayout(false);
        }
    }
}
РЕДАКТИРОВАТЬ: по запросу я добавил код, в котором создается форма, и в котором вызывается addPoint:
//a static field in the main application:
static ChartForm plot = new ChartForm();

//called once in the constructor of my main application
Application.EnableVisualStyles();
Application.Run(plot); // or whatever

//callback to ObservableConcurrentDictionary called whenever new data comes in:
[MethodImpl(MethodImplOptions.Synchronized)]
    public void onVisibilityChanged(object obj, System.Collections.Specialized.NotifyCollectionChangedEventArgs args)
    {

        KeyValuePair<string, IDistribution> tagAndState = (KeyValuePair<string, IDistribution>)args.NewItems[0];
        string tag = tagAndState.Key;
        double value = (double)tagAndState.Value;


        double now = DateTime.UtcNow.Ticks;
        TicTacToeInteraction.plot.addPoint(tag, now, value);

2 ответа
Я решил свою проблему.
Поскольку данные поступают с несбалансированной скоростью, ряды данных имеют разное количество записей. Это создает исключение. Поэтому мне пришлось установить:
IsXValueIndexed = false,
Вместо истины.
addPoint("Tag1", 10, 20);
addPoint("Tag1", 20, 30);
addPoint("Tag1", 30, 40);
addPoint("Tag1", 40, 50);

addPoint("Tag2", 10, 20);
addPoint("Tag2", 20, 70);
addPoint("Tag2", 30, 80);
addPoint("Tag2", 40, 90);
Добавьте это в свою форму Form1_Load в быстром консольном приложении, и диаграмма будет в порядке. Как выглядят ваши основные и addPoint звонки?