Как изменить цвет метки backgroup в множественном ggproto, используя ggplot2
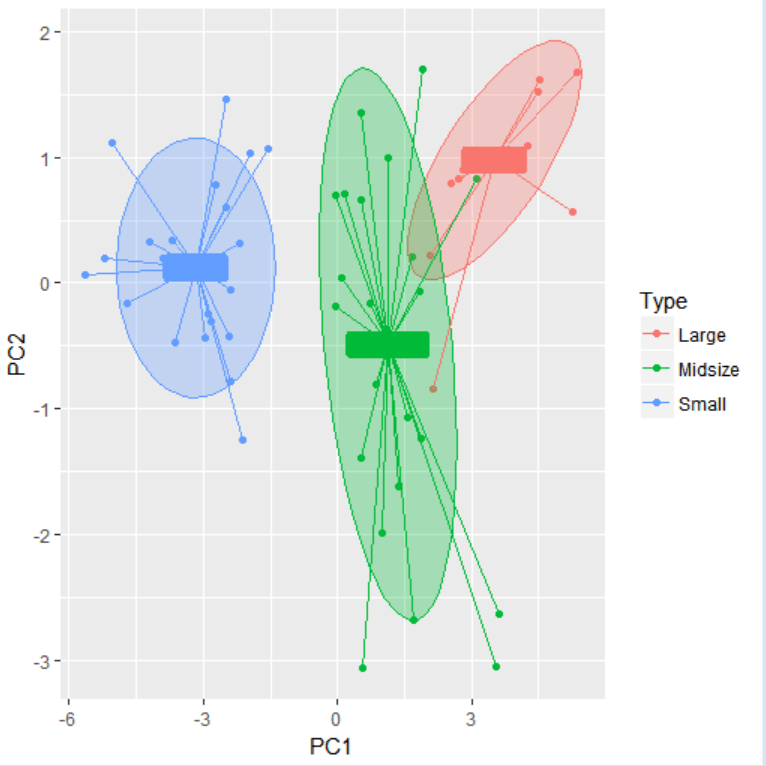
Я хочу нарисовать график, который знаком с сюжетом энтеротипа в исследовании. Но мой новый multi-ggproto кажется ужасным, как показано в p1, из-за отсутствующего фонового цвета этикетки. Я пробовал несколько вариантов этого, например, изменить GeomLabel$draw_panel для того, чтобы сбросить аргументы Geom по умолчанию в ggplot2::ggproto, Однако я не смог найти labelGrob() функция, которая удаляется в ggplot2 а также grid пакет. Таким образом, решение модификации не сработало. Как изменить цвет метки backgroup в множественном ggproto. Есть идеи? Заранее спасибо. Вот мой код и две картинки.p1: цвет фона метки должен быть белым или цвет текста должен быть черным. 
P2: отображает неправильный цвет точки, цвет линии и условные обозначения. 
geom_enterotype <- function(mapping = NULL, data = NULL, stat = "identity",  position = "identity",
                            alpha = 0.3, prop = 0.5, ..., lineend = "butt", linejoin = "round",
                            linemitre = 1, arrow = NULL, na.rm = FALSE, parse = FALSE,
                            nudge_x = 0, nudge_y = 0, label.padding = unit(0.15, "lines"),
                            label.r = unit(0.15, "lines"), label.size = 0.1,
                            show.legend = TRUE, inherit.aes = TRUE) {
library(ggplot2)
# create new stat and geom for PCA scatterplot with ellipses
StatEllipse <- ggproto("StatEllipse", Stat,
    required_aes = c("x", "y"),
    compute_group = function(., data, scales, level = 0.75, segments = 51, ...) {
    library(MASS)
    dfn <- 2
    dfd <- length(data$x) - 1
    if (dfd < 3) {
        ellipse <- rbind(c(NA, NA))
    } else {
        v <- cov.trob(cbind(data$x, data$y))
        shape <- v$cov
        center <- v$center
        radius <- sqrt(dfn * qf(level, dfn, dfd))
        angles <- (0:segments) * 2 * pi/segments
        unit.circle <- cbind(cos(angles), sin(angles))
        ellipse <- t(center + radius * t(unit.circle %*% chol(shape)))
    }
    ellipse <- as.data.frame(ellipse)
    colnames(ellipse) <- c("x", "y")
    return(ellipse)
})

# write new ggproto
GeomEllipse <- ggproto("GeomEllipse", Geom,
    draw_group = function(data, panel_scales, coord) {
            n <- nrow(data)
            if (n == 1)
            return(zeroGrob())
            munched <- coord_munch(coord, data, panel_scales)
            munched <- munched[order(munched$group), ]
            first_idx <- !duplicated(munched$group)
            first_rows <- munched[first_idx, ]
            grid::pathGrob(munched$x, munched$y, default.units = "native",
                           id = munched$group,
                           gp = grid::gpar(col = first_rows$colour,
                           fill = alpha(first_rows$fill, first_rows$alpha), lwd = first_rows$size * .pt, lty = first_rows$linetype))
             },
             default_aes = aes(colour = "NA", fill = "grey20", size = 0.5, linetype = 1, alpha = NA, prop = 0.5),
             handle_na = function(data, params) {
                   data
           },
          required_aes = c("x", "y"),
          draw_key = draw_key_path
)

# create a new stat for PCA scatterplot with lines which totally directs to the center
StatConline <- ggproto("StatConline", Stat,
    compute_group = function(data, scales) {
    library(miscTools)
    library(MASS)
    df <- data.frame(data$x,data$y)
    mat <- as.matrix(df)
    center <- cov.trob(df)$center
    names(center)<- NULL
    mat_insert <- insertRow(mat, 2, center )
    for(i in 1:nrow(mat)) {
    mat_insert <- insertRow( mat_insert, 2*i, center )
    next
    }
    mat_insert <- mat_insert[-c(2:3),]
    rownames(mat_insert) <- NULL
    mat_insert <- as.data.frame(mat_insert,center)
    colnames(mat_insert) =c("x","y")
    return(mat_insert)
    },
    required_aes = c("x", "y")

)

# create a new stat for PCA scatterplot with center labels
StatLabel <- ggproto("StatLabel" ,Stat,
               compute_group = function(data, scales) {
                library(MASS)
                df <- data.frame(data$x,data$y)
                center <- cov.trob(df)$center
                names(center)<- NULL
                center <- t(as.data.frame(center))
                center <- as.data.frame(cbind(center))
                colnames(center) <- c("x","y")
                rownames(center) <- NULL
                return(center)
                },
                required_aes = c("x", "y")
)


layer1 <- layer(data = data, mapping = mapping, stat = stat, geom = GeomPoint,
        position = position, show.legend = show.legend, inherit.aes = inherit.aes,
        params = list(na.rm = na.rm, ...))
layer2 <- layer(stat = StatEllipse, data = data, mapping = mapping, geom = GeomEllipse, position = position, show.legend = FALSE,
                     inherit.aes = inherit.aes, params = list(na.rm = na.rm, prop = prop, alpha = alpha, ...))
layer3 <- layer(data = data, mapping = mapping, stat =  StatConline, geom = GeomPath,
                                   position = position, show.legend = show.legend, inherit.aes = inherit.aes,
                                   params = list(lineend = lineend, linejoin = linejoin,
                                   linemitre = linemitre, arrow = arrow, na.rm = na.rm, ...))
if (!missing(nudge_x) || !missing(nudge_y)) {
    if (!missing(position)) {
      stop("Specify either `position` or `nudge_x`/`nudge_y`",
           call. = FALSE)
    }
    position <- position_nudge(nudge_x, nudge_y)
  }
layer4 <- layer(data = data, mapping = mapping, stat = StatLabel, geom = GeomLabel,
        position = position, show.legend = FALSE, inherit.aes = inherit.aes,
        params = list(parse = parse, label.padding = label.padding,
                      label.r = label.r, label.size = label.size, na.rm = na.rm, ...))
return(list(layer1,layer2,layer3,layer4))
}

# data
data(Cars93, package = "MASS")
car_df <- Cars93[, c(3, 5, 13:15, 17, 19:25)]
car_df <- subset(car_df, Type == "Large" | Type == "Midsize" | Type == "Small")
x1 <- mean(car_df$Price) + 2 * sd(car_df$Price)
x2 <- mean(car_df$Price) - 2 * sd(car_df$Price)
car_df <- subset(car_df, Price > x2 | Price < x1)
car_df <- na.omit(car_df)

# Principal Component Analysis
car.pca <- prcomp(car_df[, -1], scale = T)
car.pca_pre <- cbind(as.data.frame(predict(car.pca)[, 1:2]), car_df[, 1])
colnames(car.pca_pre) <- c("PC1", "PC2", "Type")
xlab <- paste("PC1(", round(((car.pca$sdev[1])^2/sum((car.pca$sdev)^2)), 2) * 100, "%)", sep = "")
ylab <- paste("PC2(", round(((car.pca$sdev[2])^2/sum((car.pca$sdev)^2)), 2) * 100, "%)", sep = "")
head(car.pca_pre)

#plot
library(ggplot2)
p1 <- ggplot(car.pca_pre, aes(PC1, PC2, fill = Type , color= Type ,label = Type)) +
geom_enterotype()
p2 <- ggplot(car.pca_pre, aes(PC1, PC2, fill = Type , label = Type)) +
geom_enterotype()
1 ответ
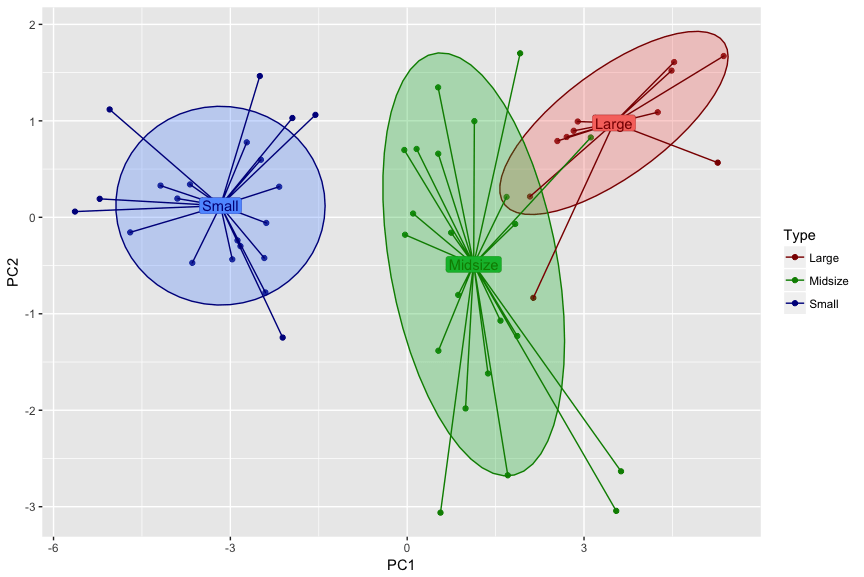
Вы можете вручную изменить цветовую шкалу, чтобы придать ей больший оттенок по сравнению с цветом заливки фона:
p3 <- ggplot(car.pca_pre, aes(PC1, PC2, fill = Type , color = Type, label = Type)) +
  geom_enterotype() +
  scale_colour_manual(values = c("red4", "green4", "blue4"))
p3
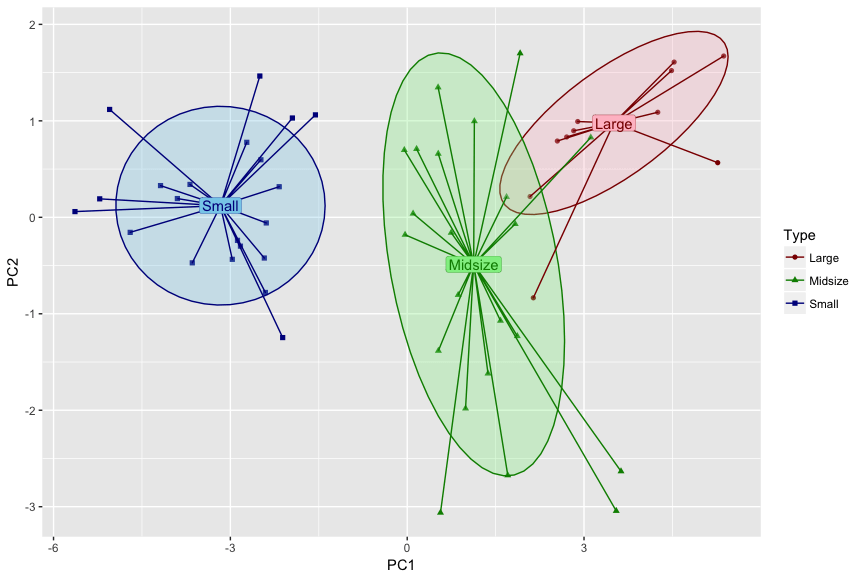
 Вы можете дополнительно отрегулировать цвета заливки, изменив значения альфа-канала или назначив другие значения цвета, чтобы повысить контрастность надписей.
p4 <- ggplot(car.pca_pre, aes(PC1, PC2, label = Type, shape = Type, fill = Type, colour = Type)) +
  geom_enterotype() +
  scale_fill_manual(values = alpha(c("pink", "lightgreen", "skyblue"), 1)) +
  scale_colour_manual(values = c("red4", "green4", "blue4"))
p4
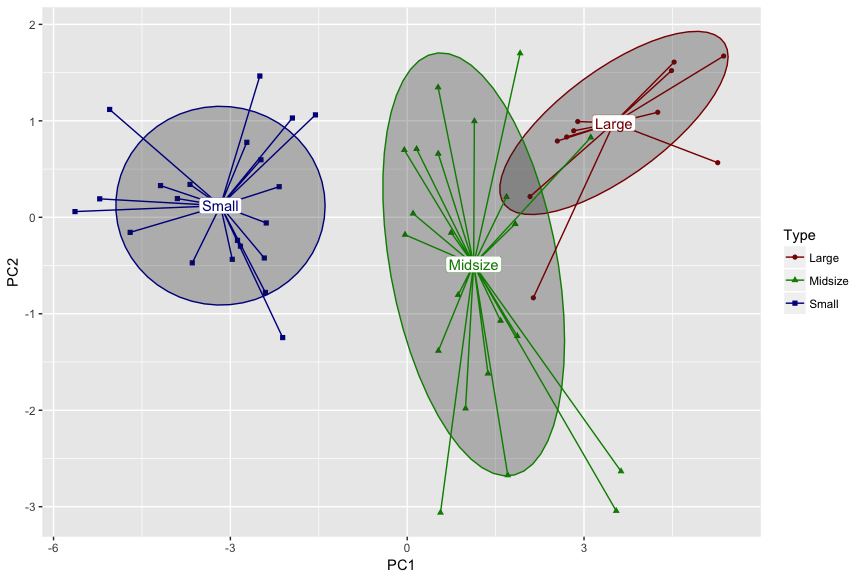
Наконец, если вы хотите, чтобы фон был белого цвета для ваших надписей, вы должны удалить опцию заливки. Вы также можете дополнительно назначить значение формы.
Как вы можете заметить, цвет фона текста связан с цветом заливки формы, а цвет текстовой метки связан с цветом линии, цветом границы формы.
 p5 <- ggplot(car.pca_pre, aes(PC1, PC2, label = Type, shape = Type, colour = Type)) +
  geom_enterotype() + scale_colour_manual(values = c("red4", "green4", "blue4"))
 p5

