как добавить таблицу в ggplot?
Я пытаюсь объединить (в одном графике) обычный ggplot диаграмма с таблицей, полученной с помощью flextable.
Рассмотрим следующий пример:
library(tidyverse)
library(patchwork)
mydf <- tibble(a = c(1,2,3,4,5,4),
b = c(4,4,4,3,3,3))
p1 <- mydf %>% ggplot(aes(x = a, y = b, color = as.factor(b))) + geom_point()
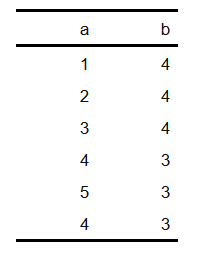
p2 <- mydf %>% flextable::flextable()
p2 выглядит как
но, к сожалению, я не могу совместить это с p1
> p1 + p2
Error: Don't know how to add p2 to a plot
Что мы можем сделать? Спасибо!
3 ответа
Решение
Вы можете использовать функцию flextable::as_raster чтобы получить растр из флештаба, а затем добавить с помощью annotation_custom к пустому объекту ggplot.
library(ggplot2)
library(flextable)
library(grid)
library(cowplot)
library(tidyverse)
mydf <- tibble(a = c(1,2,3,4,5,4),
b = c(4,4,4,3,3,3))
p1 <- mydf %>% ggplot(aes(x = a, y = b, color = as.factor(b))) + geom_point()
ft_raster <- mydf %>% flextable::flextable() %>%
as_raster()
p2 <- ggplot() +
theme_void() +
annotation_custom(rasterGrob(ft_raster), xmin=-Inf, xmax=Inf, ymin=-Inf, ymax=Inf)
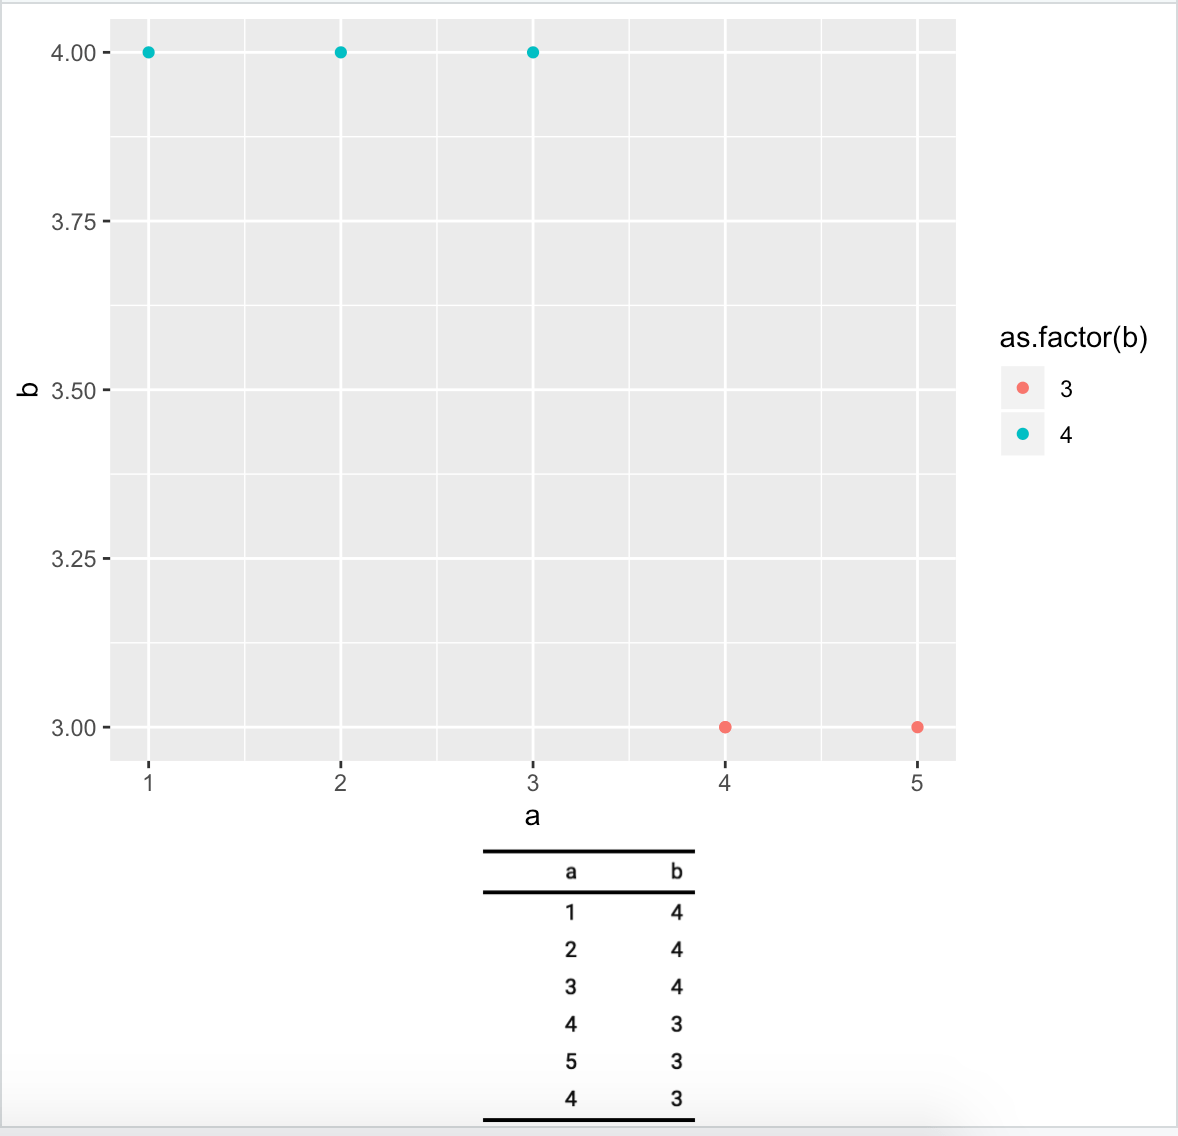
cowplot::plot_grid(p1, p2, nrow = 2, ncol = 1, rel_heights = c(4, 1) )
https://stackru.com/images/68015907f8128d73bc46be23b7d4206402ad3786.png
Документация находится здесь: https://davidgohel.github.io/flext able/articles/offcran/images.html.
tableGrob от gridExtra пакет тоже работает
library(tidyverse)
library(grid)
library(gridExtra)

mydf <- tibble(a = c(1,2,3,4,5,4),
               b = c(4,4,4,3,3,3))

p1 <- mydf %>% ggplot(aes(x = a, y = b, color = as.factor(b))) + geom_point()

mytheme <- gridExtra::ttheme_default(
  core = list(padding = unit(c(2.5, 2.5), "mm")))
tbl <- tableGrob(mydf, theme = mytheme, rows = NULL)

grid.arrange(p1,
             tbl,
             nrow = 2,
             as.table = TRUE,
             heights = c(4, 1))

Создано 21.02.2020 с помощью пакета REPEX (v0.3.0)
Следующие 2 способа есть
library(tidyverse)
library(ggpmisc)
mydf <- tibble(a = c(1,2,3,4,5,4),
b = c(4,4,4,3,3,3))
p1 <- mydf %>% ggplot(aes(x = a, y = b, color = as.factor(b))) + geom_point()
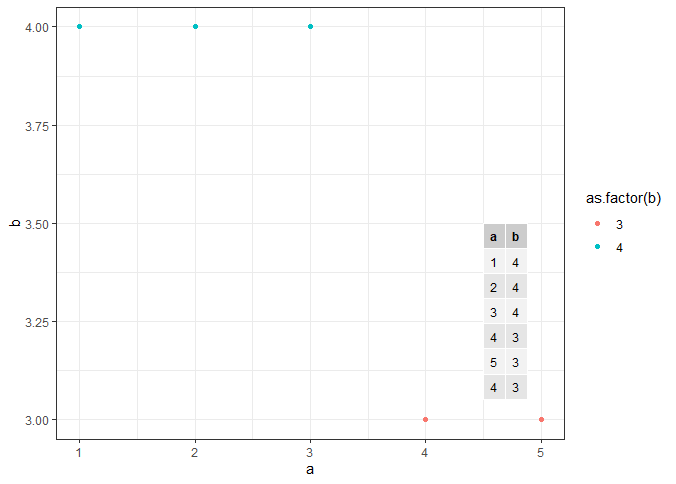
p1 + annotate(geom = "table", x = 4.5, y = 3.5, label = list(mydf),
vjust = 1, hjust = 0)
p1 + geom_table_npc(data = mydf, label = list(mydf),npcx = 0.05, npcy = 0.90, hjust = 0, vjust = 1)