Изменение размера шрифта в сюжетах Python
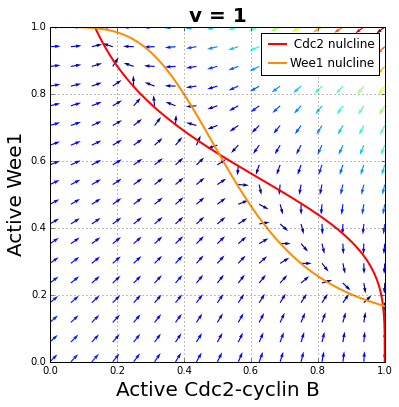
Я сделал фазовый график стабильной бистабильной системы с нулями на главном графике и добавил вспомогательный участок с перекрывающими его траекториями. Однако, что бы я ни пытался, я не могу добиться увеличения размера шрифта надписей x и y до 20.
Любая помощь будет принята с благодарностью.
Хотя есть похожие вопросы, ответы на указанные запросы, похоже, не относятся к этой конкретной проблеме.
Еще раз спасибо!
import numpy as np
from scipy.integrate import odeint
import matplotlib.pyplot as plt
from mpl_toolkits.axes_grid.axislines import SubplotZero
from matplotlib import pylab
from pylab import linspace
from numpy import meshgrid
from numpy import hypot


a1 = 1.0 #(Rate constant)
g1 = 4.0 # Hill number for cdc2
b1 = 200.0 # Rate Constant
k1 = 30.0 #Michaelis Constant
v =1 #coefficient that reflects the strangth of the influence of Wee1 on Cdc2
a2 = 1.0# Rate Constant
g2 = 4.0 #Hill number for Wee1
b2 = 10.0 # Rate Constant
k2 = 1.0# Michaelis constant

# Function for calculating the phase plot
def Function(u,t=0,mu=.1):
    x1 = u[0]
    y1 = u[1]
    dv = (a2* (1.0 - y1) - (b2 * y1 * x1**g2) /(k2 + (x1**g2)))                 # Model of Cdc2
    dx = (a1* (1.0 - x1) - (b1 * x1 * ((v * y1)**g1)) / (k1 + ((v*y1) **g1)))  # Model of Wee1
    return (dx,dv)

t = linspace(0,1,1) #Return list from 0 to 1 in 25 intervals
u0 = np.array([1,1]) # Creates array for odeint function


mu = [1,10] #call mu for 2
for m in mu:#Get u (differentiation function )
    u = odeint(Function,u0,t,args=(m,))
#   ax.plot(u[0:,0],u[0:,1])
x = linspace(0,1,17) #Creates values for x
y = linspace(0,1,18)#Creates values for y to plot
x,y = meshgrid(x,y)# creates a grid of x by y
X,Y = Function([x,y])# Applies funciton to grid
M = (hypot(X,Y))# Get hypotenuse of X by Y
X,Y = X/M, Y/M# Calculate length(strength) of arrows


#Calculate Nulclines-----------------------------------------------------------

Nulclinevalues = np.arange(0, 1+0.001, 0.001)#Calulate values to set nulcineto
NulclineXX = []# set to an array
NulclineYY = []#set to an array
 # Following 2 formulas show the calculation fo the nullclines
def calcnulclineyy(xx1):
    oa2 = 1.0#RAte constant
    og2 = 4.0 #Hill number for Wee1
    ob2 = 10.0#Rate constant
    ok2 = 1.0#Michaelis constant
    YY = (oa2*((xx1)**og2) + ok2) / (oa2*((xx1**og2)+ok2)+(ob2*(xx1**og2)))

return YY


def calcnulclinexx(yy1):
    oa1 = 1.0 #Rate constant
    og1 = 4.0 # Hill number for cdc2
    ob1 = 200.0 #Rate constant
    ok1 = 30.0#Michaelis constant
    ov = 1##coefficient that reflects the strength of the influence of Wee1 on Cdc2
    og2 = 4.0 #Hill number for Wee1
    XX = (oa1*(ok1+(ov*yy1)**og2)) / (oa1*(ok1+(ov*yy1)**og1)+ob1*(ov*yy1)**og1)

return XX

for YY in Nulclinevalues:
    # print Y
    NulclineXX.append(calcnulclinexx(YY))

for XX in Nulclinevalues:
    #Print X
    NulclineYY.append(calcnulclineyy(XX))


fig = plt.figure(figsize=(6,6)) # 6x6 image

ax = SubplotZero(fig,111,) #Plot arrows over figure

fig.add_subplot(ax) # Plot arrows over figure

# Plot both nulcines on same graph

plt.axis((0,1,0,1))
ax.set_title('v = 1',fontweight="bold", size=20) # Title
ax.set_ylabel('Active Wee1', fontsize = 20.0) # Y label
ax.set_xlabel('Active Cdc2-cyclin B', fontsize = 20) # X label
plt.plot (NulclineXX,Nulclinevalues, label = " Cdc2 nulcline",c = 'r', linewidth = '2')
plt.plot (Nulclinevalues,NulclineYY, label = "Wee1 nulcline",c = '#FF8C00', linewidth = '2')

ax.quiver(x,y,X,Y,M) # plot quiver plot on graph
ax.grid(True) # Show major ticks
ax.legend(handletextpad=0,loc='upper right') # Plot legend

plt.show() # Show plot
2 ответа
Вот изменения, которые я внес в последний бит вашего кода:
fig = plt.figure(figsize=(6,6)) # 6x6 image

ax = plt.gca()       #SubplotZero(fig,111,) #Plot arrows over figure

#fig.add_subplot(ax) # Plot arrows over figure

# Plot both nulcines on same graph

plt.axis((0,1,0,1))
ax.set_title('v = 1',fontweight="bold", size=20) # Title
ax.set_ylabel('Active Wee1', fontsize = 20.0) # Y label
ax.set_xlabel('Active Cdc2-cyclin B', fontsize = 20) # X label
plt.plot (NulclineXX,Nulclinevalues, label = " Cdc2 nulcline",c = 'r')
plt.plot (Nulclinevalues,NulclineYY, label = "Wee1 nulcline",c = '#FF8C00')

ax.quiver(x,y,X,Y,M) # plot quiver plot on graph
ax.grid(True) # Show major ticks
ax.legend(handletextpad=0,loc='upper right') # Plot legend

plt.show() # Show plot
Я изменил способ определения топора и удалил вызов, добавив его к фигуре. (Я также сделал 2 других изменения, которые вам, вероятно, не нужны - по какой-то причине моей установке не понравились инструкции по ширине линии, когда я пытался их показать, поэтому я их вынул - похоже, что-то не так с моей установкой).
Просто используйте
fig, ax = plt.subplots(figsize=(6,6))
вместо:
fig = plt.figure(figsize=(6,6)) # 6x6 image
ax = SubplotZero(fig,111,) #Plot arrows over figure
fig.add_subplot(ax) # Plot arrows over figure
Кстати хороший сюжет!