Как обновить карту листовки в selectModUI в приложении Shiny?
Я хотел бы обновить selectModUI от mapedit пакет для разных leaflet карты при использовании Shiny, Ниже приведен рабочий пример.
library(tidyverse)
library(shiny)
library(sf)
library(leaflet)
library(mapview)
library(mapedit)
library(DT)
library(viridis)

# Load the sf object
nc <- st_read(system.file("shape/nc.shp", package = "sf"))

# Project transformation
nc <- st_transform(nc, crs = 4326)

# Create a color function for the leaflet map
sid74_pal <- colorBin(palette = viridis(10), domain = nc$SID74, bins = 4)

# Create a leaflet map
sid74_map <- leaflet() %>%
  addTiles(group = "OSM") %>%
  addProviderTiles("CartoDB", group = "CartoDB") %>%
  addProviderTiles("Esri.WorldImagery", group = "Esri.WorldImagery") %>%
  addFeatures(nc,
              color = ~sid74_pal(SID74),
              label = ~htmltools::htmlEscape(NAME),
              layerId = ~seq_len(length(st_geometry(nc)))) %>%
  addLegend(position = "bottomright", pal = sid74_pal,
            values = nc$SID74,
            title = "SID74") %>%
  addLayersControl(baseGroups = c("OSM", "CartoDB", "Esri.WorldImagery"))

ui <- fluidPage(
  # Select Module Output
  h3("Map"),
  selectModUI(id = "Sel_Map"),
  # Datatable Output
  h3("Table"),
  dataTableOutput(outputId = "Table")
)

server <- function(input, output) {
  # Create selectMod
  sel <- callModule(selectMod, "Sel_Map", sid74_map)

  # Reactive values
  rv <- reactiveValues(
    selectnum = NULL,
    sub_table = nc %>%
      st_set_geometry(NULL) %>%
      slice(0)
  )

  # Subset the table based on the selection
  observe({
    # the select module returns a reactive
    gs <- sel()
    # Filter for the county data
    rv$selectnum <- as.numeric(gs[which(gs$selected == TRUE), "id"])

    if (!is.null(rv$selectnum)){
      rv$sub_table <- nc %>%
        st_set_geometry(NULL) %>%
        slice(rv$selectnum)
    }
  })

  # Create a datatable
  output$Table <- renderDataTable({
    datatable(rv$sub_table, options = list(scrollX = TRUE))
  })

}

# Run the application
shinyApp(ui = ui, server = server)
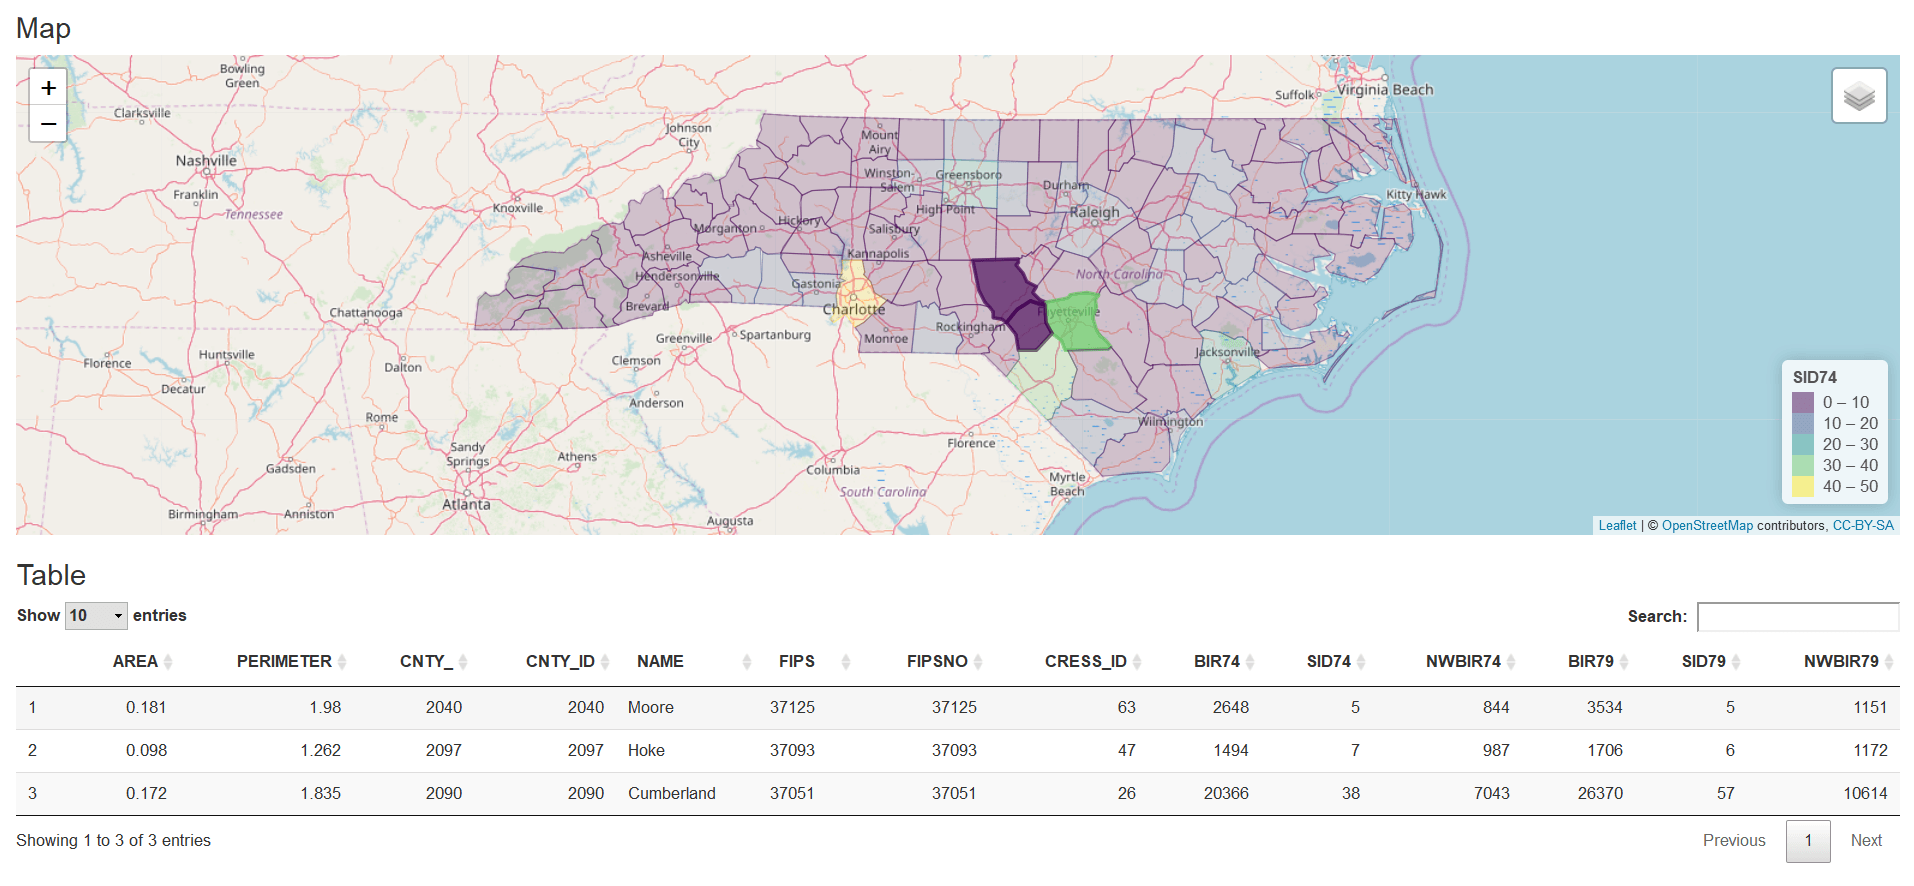
Идея состоит в том, чтобы создать карту, и пользователи могут выбирать или отменять выбор полигонов на карте. На основе выбора пользователей выходные данные таблицы данных будут динамически показывать, какие графства выбраны, и представлять данные, как показано на скриншоте.
Теперь я хочу добавить выбранный вход, чтобы пользователи могли решать, какой параметр они хотят визуализировать, используя приложение. Я чувствую, что могу создать некоторые виды реактивности или реактивные значения для хранения карт, а затем обновить нижеприведенный пример, который я создал. Обратите внимание, что по сравнению с примером 1 я создал новую карту листовок под названием sid79_map в Примере 2 и добавьте выбор выбора, чтобы люди могли выбирать. Однако эта стратегия не работает. Было бы здорово, если бы кто-то мог указать направление, по которому нужно идти.
library(tidyverse)
library(shiny)
library(sf)
library(leaflet)
library(mapview)
library(mapedit)
library(DT)
library(viridis)

# Load the sf object
nc <- st_read(system.file("shape/nc.shp", package = "sf"))

# Project transformation
nc <- st_transform(nc, crs = 4326)

# Create a color function for the leaflet map
sid74_pal <- colorBin(palette = viridis(10), domain = nc$SID74, bins = 4)
sid79_pal <- colorBin(palette = viridis(10), domain = nc$SID79, bins = 4)

# Create a leaflet map
sid74_map <- leaflet() %>%
  addTiles(group = "OSM") %>%
  addProviderTiles("CartoDB", group = "CartoDB") %>%
  addProviderTiles("Esri.WorldImagery", group = "Esri.WorldImagery") %>%
  addFeatures(nc,
              color = ~sid74_pal(SID74),
              label = ~htmltools::htmlEscape(NAME),
              layerId = ~seq_len(length(st_geometry(nc)))) %>%
  addLegend(position = "bottomright", pal = sid74_pal,
            values = nc$SID74,
            title = "SID74") %>%
  addLayersControl(baseGroups = c("OSM", "CartoDB", "Esri.WorldImagery"))

sid79_map <- leaflet() %>%
  addTiles(group = "OSM") %>%
  addProviderTiles("CartoDB", group = "CartoDB") %>%
  addProviderTiles("Esri.WorldImagery", group = "Esri.WorldImagery") %>%
  addFeatures(nc,
              color = ~sid79_pal(SID79),
              label = ~htmltools::htmlEscape(NAME),
              layerId = ~seq_len(length(st_geometry(nc)))) %>%
  addLegend(position = "bottomright", pal = sid79_pal,
            values = nc$SID79,
            title = "SID79") %>%
  addLayersControl(baseGroups = c("OSM", "CartoDB", "Esri.WorldImagery"))

ui <- fluidPage(
  # Select input
  selectInput(inputId = "Selection", label = "Select Counties", choices = c("SID74", "SID79"), selected = "SID74"),
  # Select Module Output
  h3("Map"),
  selectModUI(id = "Sel_Map"),
  # Datatable Output
  h3("Table"),
  dataTableOutput(outputId = "Table")
)

server <- function(input, output) {

  # Try to create reactivity based on the select input type, not working
  sel_type <- reactive({
    input$Selection
  })

  leafmap <- reactive({
    if(sel_type() == "SID74"){
      sid74_map
    } else if (sel_type() == "SID79"){
      sid79_map
    }
  })

  # Create selectMod
  sel <- callModule(selectMod, "Sel_Map", leafmap())

  # Reactive values
  rv <- reactiveValues(
    selectnum = NULL,
    sub_table = nc %>%
      st_set_geometry(NULL) %>%
      slice(0)
  )

  # Subset the table based on the selection
  observe({
    # the select module returns a reactive
    gs <- sel()
    # Filter for the county data
    rv$selectnum <- as.numeric(gs[which(gs$selected == TRUE), "id"])

    if (!is.null(rv$selectnum)){
      rv$sub_table <- nc %>%
        st_set_geometry(NULL) %>%
        slice(rv$selectnum)
    }
  })

  # Create a datatable
  output$Table <- renderDataTable({
    datatable(rv$sub_table, options = list(scrollX = TRUE))
  })

}

# Run the application
shinyApp(ui = ui, server = server)
1 ответ
Основная проблема в том, что ваш callModule() должен быть внутри реактивного контекста. Я немного изменил ваш пример, чтобы исправить это, используя observeEvent(),
Смотри ниже (я импортировал dplyr::slice потому что я хотел избежать полной загрузки tidyverse).
Изменить: я сделал некоторые дальнейшие очистки и добавил пользовательскую версию selectMod чтобы ответить на комментарий ОП.
library(shiny)
library(sf)
library(leaflet)
library(mapview)
library(mapedit)
library(DT)
library(viridis)

# Load the sf object
nc <- st_read(system.file("shape/nc.shp", package = "sf"))

# Project transformation
nc <- st_transform(nc, crs = 4326)

# Create a color function for the leaflet map
sid74_pal <- colorBin(palette = viridis(10), domain = nc$SID74, bins = 4)
sid79_pal <- colorBin(palette = viridis(10), domain = nc$SID79, bins = 4)

# Create a leaflet map
sid74_map <- leaflet() %>%
  addTiles(group = "OSM") %>%
  addProviderTiles("CartoDB", group = "CartoDB") %>%
  addProviderTiles("Esri.WorldImagery", group = "Esri.WorldImagery") %>%
  addFeatures(nc,
              color = ~sid74_pal(SID74),
              label = ~htmltools::htmlEscape(NAME),
              layerId = ~seq_len(length(st_geometry(nc)))) %>%
  addLegend(position = "bottomright", pal = sid74_pal,
            values = nc$SID74,
            title = "SID74") %>%
  addLayersControl(baseGroups = c("OSM", "CartoDB", "Esri.WorldImagery"))

sid79_map <- leaflet() %>%
  addTiles(group = "OSM") %>%
  addProviderTiles("CartoDB", group = "CartoDB") %>%
  addProviderTiles("Esri.WorldImagery", group = "Esri.WorldImagery") %>%
  addFeatures(nc,
              color = ~sid79_pal(SID79),
              label = ~htmltools::htmlEscape(NAME),
              layerId = ~seq_len(length(st_geometry(nc)))) %>%
  addLegend(position = "bottomright", pal = sid79_pal,
            values = nc$SID79,
            title = "SID79") %>%
  addLayersControl(baseGroups = c("OSM", "CartoDB", "Esri.WorldImagery"))

selectMod <- function(input, output, session, leafmap,
                      styleFalse = list(fillOpacity = 0.2, weight = 1, opacity = 0.4),
                      styleTrue = list(fillOpacity = 0.7, weight = 3, opacity = 0.7))
{
  print("*** custom selectMod")
  output$map <- leaflet::renderLeaflet({
    mapedit:::add_select_script(leafmap, styleFalse = styleFalse, styleTrue = styleTrue,
                                ns = session$ns(NULL))
  })
  id <- "mapedit"
  select_evt <- paste0(id, "_selected")
  df <- data.frame()
  selections <- reactive({
    id <- as.character(input[[select_evt]]$id)
    if (length(df) == 0) {
      # Initial case, first time module is called.
      # Switching map, i.e. subsequent calls to the module.
      # Note that input[[select_evt]] will always keep the last selection event,
      # regardless of this module being called again.
      df <<- data.frame(id = character(0), selected = logical(0),
                        stringsAsFactors = FALSE)
    } else {
      loc <- which(df$id == id)
      if (length(loc) > 0) {
        df[loc, "selected"] <<- input[[select_evt]]$selected
      } else {
        df[nrow(df) + 1, ] <<- c(id, input[[select_evt]]$selected)
      }
    }
    return(df)
  })
  return(selections)
}


ui <- fluidPage(
  # Select input
  selectInput(inputId = "Selection", label = "Select Counties", choices = c("SID74", "SID79"), selected = "SID74"),
  # Select Module Output
  h3("Map"),
  selectModUI(id = "Sel_Map"),
  # Datatable Output
  h3("Table"),
  dataTableOutput(outputId = "Table")
)

server <- function(input, output) {

  # Reactivity based on the select input type
  leafmap <- reactive({
    my_sel <- input$Selection
    if (my_sel == "SID74") {
      sid74_map
    } else if (my_sel == "SID79") {
      sid79_map
    }
  })

  # Reactive values
  rv <- reactiveValues(
    sel = reactive({}),
    selectnum = NULL,
    sub_table = nc %>%
      st_set_geometry(NULL) %>%
      dplyr::slice(0)
  )

  # Create selectMod
  observeEvent(leafmap(),
    rv$sel <- callModule(selectMod, "Sel_Map", leafmap())
  )

  # Subset the table based on the selection
  observeEvent(rv$sel(), {
    # The select module returns a reactive
    gs <- rv$sel()
    # Filter for the county data
    rv$selectnum <- as.numeric(gs[which(gs$selected == TRUE), "id"])

    rv$sub_table <- nc %>%
      st_set_geometry(NULL) %>%
      dplyr::slice(rv$selectnum)
  })

  # Create a datatable
  output$Table <- renderDataTable({
    datatable(rv$sub_table, options = list(scrollX = TRUE))
  })

}

# Run the application
shinyApp(ui = ui, server = server)