Карта маркеров листовки
Я пытаюсь разработать приложение для отображения услуг на листовой карте:
Можно ли иметь разные маркеры в соответствии с атрибутом geojson "properties"?
{
   "type": "FeatureCollection",
   "features": [
  {
    "type": "Feature",
    "geometry": {
       "type": "Point",
       "coordinates":  [ 6.1200622,46.2106091 ]
    },
    "properties": {
    "nom":"Cfffff Genève",
    "rue":"Route des F",
    "num":"11",
    "npa":1203,
    "localite":"Genève",
    "canton":"GE",
    "tel":"033 345 17 57",
    "url":"www.formation-cemea.ch",
    "domaine":"société   "
    }},
вот мой скрипт для карты: 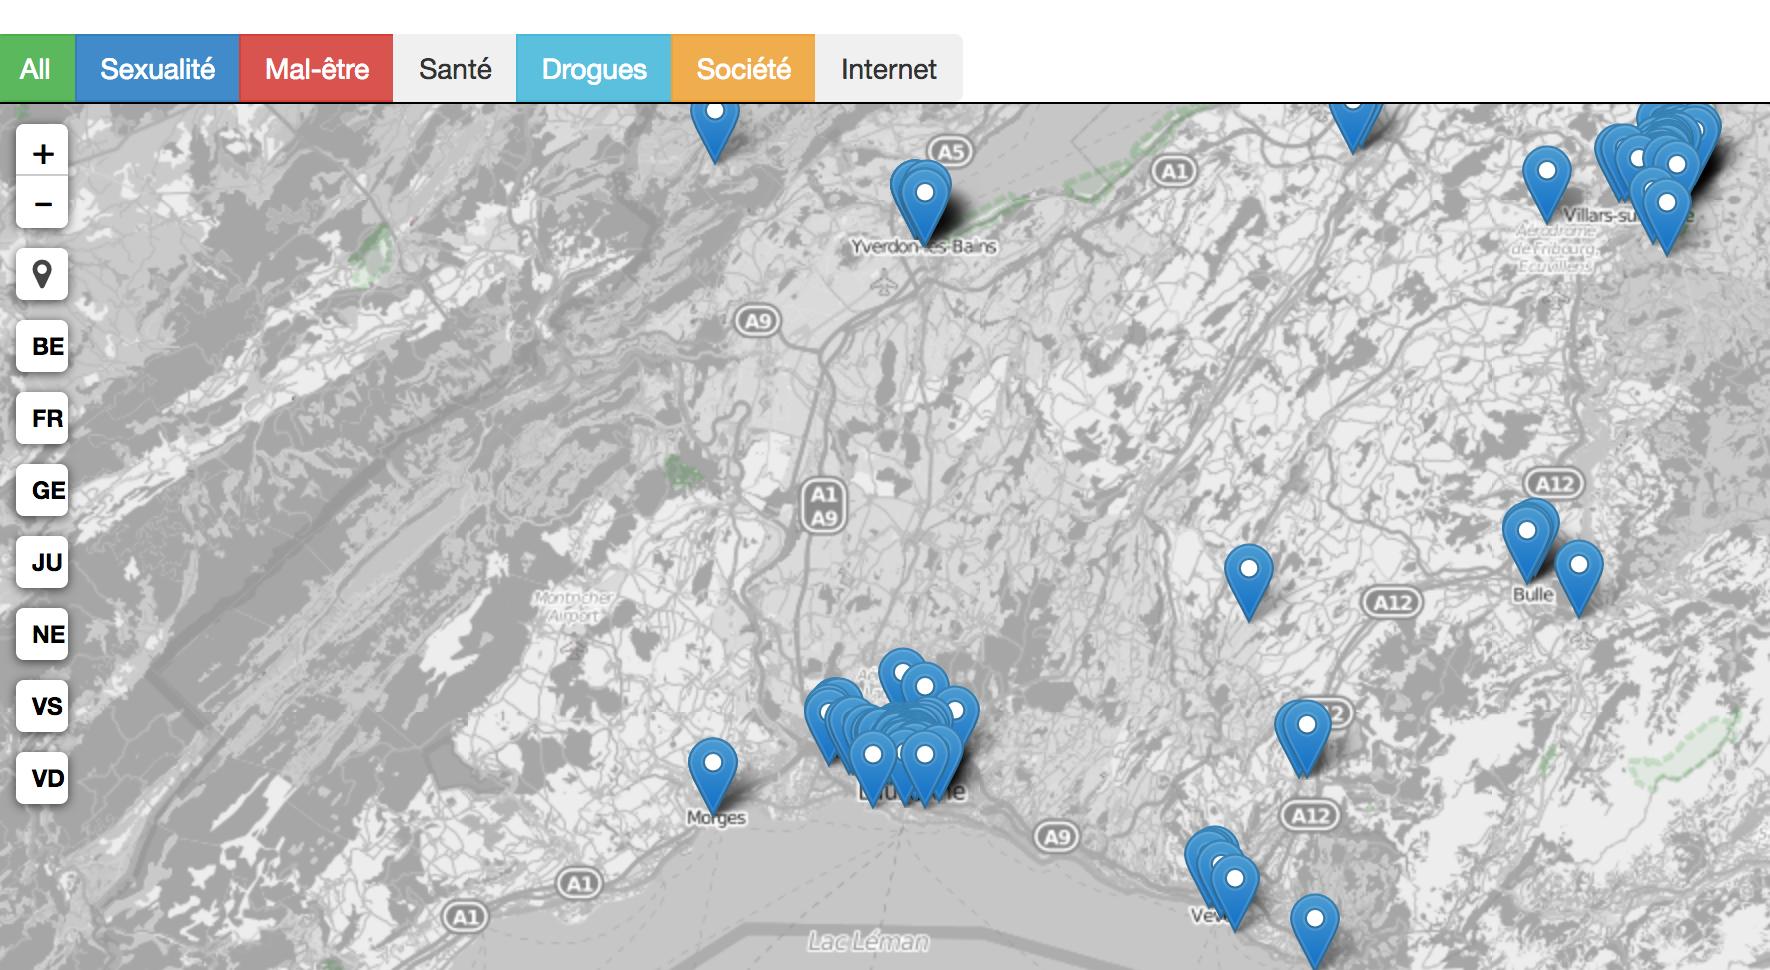 я хочу, чтобы при нажатии на кнопку сверху отображались только маркеры, соответствующие свойствам (другого цвета)? СПАСИБО ВСЕМ БОЛЬШЕ за любую помощь;)
<div class="btn-group">
<button type="button" id="allbus" class="btn btn-success">All</button>
<button type="button" id="others" class="btn btn-primary">Sexualité</button>
<button type="button" id="cafes" class="btn btn-danger">Mal-être</button>
<button type="button" id="cafes" class="btn btn-secondary">Santé</button>
<button type="button" id="cafes" class="btn btn-info">Drogues</button>
<button type="button" class="btn btn-warning">Société</button>
<button type="button" class="btn btn-outline-success">Internet</button>
</div>
<body>
<div id="map"></div>
<script type="text/javascript">
var map = L.map('map');
var terrainTiles = L.tileLayer('http://{s}.tiles.wmflabs.org/bw-mapnik/{z}/{x}/{y}.png', {
maxZoom: 18,
attribution: '© <a href="http://www.openstreetmap.org/copyright">OpenStreetMap</a>'
});
terrainTiles.addTo(map);
map.setView([46.5160000, 6.6328200], 10);
L.control.locate(location).addTo(map);
L.easyButton( '<strong>BE</strong>', function(){
//zoomTo.setView([55, -2], 4);
map.setView([46.95, 6.85], 12);
}).addTo(map);
L.easyButton( '<strong>FR</strong>', function(){
//zoomTo.setView([55, -2], 4);
map.setView([46.95, 6.85], 12);
}).addTo(map);
L.easyButton( '<strong>GE</strong>', function(){
//zoomTo.setView([55, -2], 4);
map.setView([46.95, 6.85], 12);
}).addTo(map)
L.easyButton( '<strong>JU</strong>', function(){
//zoomTo.setView([55, -2], 4);
map.setView([46.95, 6.85], 12);
}).addTo(map);
L.easyButton( '<strong>NE</strong>', function(){
//zoomTo.setView([55, -2], 4);
map.setView([46.95, 6.85], 12);
}).addTo(map);
L.easyButton( '<strong>VS</strong>', function(){
//zoomTo.setView([55, -2], 4);
map.setView([46.95, 6.85], 12);
}).addTo(map);
L.easyButton( '<strong>VD</strong>', function(){
//zoomTo.setView([55, -2], 4);
map.setView([46.95, 6.85], 12);
}).addTo(map);
function addDataToMap(data, map) {
var dataLayer = L.geoJson(data, {
onEachFeature: function(feature, layer) {
var popupText = "<b>" + feature.properties.nom
+ "<br>"
+ "<small>" + feature.properties.localite
+ "<br>Rue: " + feature.properties.rue + + feature.properties.num
+ "<br>Téléphone: " + feature.properties.tel
+ "<br><a href= '" + feature.properties.url + "'>Internet</a>";
layer.bindPopup(popupText); }
});
dataLayer.addTo(map);
}
$.getJSON("data.geojson", function(data) { addDataToMap(data, map); });
</script>
</body>
</html>2 ответа
Вы можете использовать экземпляр слоя в вашем onEachFeature Метод, проверьте, если это маркер и установите его значок:
new L.GeoJSON(null ,{
    onEachFeature: function (feature, layer) {
        if (layer instanceof L.Marker) {
            layer.setIcon(new L.Icon(...));
        }
    }
})
Вы можете использовать круговые маркеры L.circleMarker дифференцировать ваши очки на основе feature.properties.[VALUE], И вы можете добавить фильтр также. Например, на основе TotalImpct имущество:
munCustomLayer = L.geoJson(null, {
        onEachFeature: {SOME FUNCTION},

        filter: function (feature, layer) {
             return feature.properties.TotalImpct > 10000;
        },
        pointToLayer: function(feature, latlng) { //Style the layer based on TotalImpact
            if (feature.properties.TotalImpct < 50000){
                return new L.CircleMarker(latlng, {
                    radius: 5,
                    color: "#e0e0e0",
                    opacity: 0.95,
                    weight: 1.2,
                    dashArray: "2,3",
                    fillOpacity: 0.01,
                });
            }
(...)
Вы можете увидеть пример использования круговых маркеров здесь. (Не забудьте проверить исходный код).