Как узнать текущее использование процессора и оперативной памяти в Python?
Какой ваш предпочтительный способ получения текущего состояния системы (текущий процессор, оперативная память, свободное место на диске и т. Д.) В Python? Бонусные баллы для *nix и Windows платформ.
Кажется, есть несколько возможных способов извлечь это из моего поиска:
Использование библиотеки, такой как PSI (которая в настоящее время, кажется, не активно развивается и не поддерживается на нескольких платформах) или что-то вроде pystatgrab (опять же, с 2007 года, похоже, нет активности и нет поддержки Windows).
Использование кода, специфичного для платформы, например, использование
os.popen("ps")или аналогичные для систем *nix иMEMORYSTATUSвctypes.windll.kernel32(см. этот рецепт на ActiveState) для платформы Windows. Можно поместить класс Python вместе со всеми этими фрагментами кода.
Не то чтобы эти методы плохие, но уже есть хорошо поддерживаемый, многоплатформенный способ сделать то же самое?
21 ответ
Библиотека psutil предоставит вам некоторую системную информацию (использование ЦП / памяти) на различных платформах:
psutil - это модуль, предоставляющий интерфейс для извлечения информации о запущенных процессах и использовании системы (ЦП, память) переносимым способом с использованием Python, реализуя многие функции, предлагаемые такими инструментами, как ps, top и диспетчер задач Windows.
В настоящее время он поддерживает Linux, Windows, OSX, Sun Solaris, FreeBSD, OpenBSD и NetBSD, как 32-разрядные, так и 64-разрядные архитектуры, с версиями Python от 2.6 до 3.5 (пользователи Python 2.4 и 2.5 могут использовать версию 2.1.3).
ОБНОВЛЕНИЕ: Вот несколько примеров использования psutil:
#!/usr/bin/env python
import psutil
# gives a single float value
psutil.cpu_percent()
# gives an object with many fields
psutil.virtual_memory()
# you can convert that object to a dictionary
dict(psutil.virtual_memory()._asdict())
Используйте библиотеку psutil. Для меня на Ubuntu, pip установлен 0.4.3. Вы можете проверить свою версию psutil, выполнив это в Python:
from __future__ import print_function
import psutil
print(psutil.__version__)
Чтобы получить статистику по памяти и процессору:
from __future__ import print_function
import psutil
print(psutil.cpu_percent())
print(psutil.virtual_memory()) #  physical memory usage
Мне также нравится делать это:
import os
import psutil
pid = os.getpid()
py = psutil.Process(pid)
memoryUse = py.memory_info()[0]/2.**30  # memory use in GB...I think
print('memory use:', memoryUse)
который дает текущее использование памяти вашего скрипта Python.
На странице pypi есть еще несколько подробных примеров для 4.3.0 и 0.5.0.
Для Ubuntu 16 и 14 установка из pip дала мне версию 4.3.0, в которой нет метода phymem_usage(). Чтобы получить 0.5.0, вы можете сделать pip install psutil==0.5.0 или загрузите файл tar.gz, затем выполните
tar -xvzf psutil-0.5.0.tar.gz
cd psutil-0.5.0
sudo python setup.py install
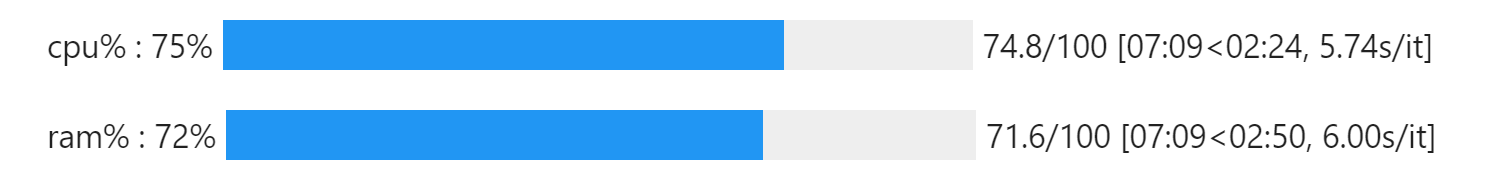
Можно получить мониторинг ЦП и ОЗУ в реальном времени, объединив
tqdm а также
psutil. Это может быть удобно при выполнении тяжелых вычислений / обработки.

Он также работает в Jupyter без каких-либо изменений кода:
      from tqdm import tqdm
from time import sleep
import psutil

with tqdm(total=100, desc='cpu%', position=1) as cpubar, tqdm(total=100, desc='ram%', position=0) as rambar:
    while True:
        rambar.n=psutil.virtual_memory().percent
        cpubar.n=psutil.cpu_percent()
        rambar.refresh()
        cpubar.refresh()
        sleep(0.5)
Этот фрагмент кода также доступен как суть .
Одна строка для использования оперативной памяти только с зависимостью stdlib:
import os
tot_m, used_m, free_m = map(int, os.popen('free -t -m').readlines()[-1].split()[1:])
У меня ниже коды, без внешних библиотек работали. Я тестировал на Python 2.7.9
Использование процессора
import os

    CPU_Pct=str(round(float(os.popen('''grep 'cpu ' /proc/stat | awk '{usage=($2+$4)*100/($2+$4+$5)} END {print usage }' ''').readline()),2))

    #print results
    print("CPU Usage = " + CPU_Pct)
И использование плунжера, всего, б / у и бесплатно
import os
mem=str(os.popen('free -t -m').readlines())
"""
Get a whole line of memory output, it will be something like below
['             total       used       free     shared    buffers     cached\n',
'Mem:           925        591        334         14         30        355\n',
'-/+ buffers/cache:        205        719\n',
'Swap:           99          0         99\n',
'Total:        1025        591        434\n']
 So, we need total memory, usage and free memory.
 We should find the index of capital T which is unique at this string
"""
T_ind=mem.index('T')
"""
Than, we can recreate the string with this information. After T we have,
"Total:        " which has 14 characters, so we can start from index of T +14
and last 4 characters are also not necessary.
We can create a new sub-string using this information
"""
mem_G=mem[T_ind+14:-4]
"""
The result will be like
1025        603        422
we need to find first index of the first space, and we can start our substring
from from 0 to this index number, this will give us the string of total memory
"""
S1_ind=mem_G.index(' ')
mem_T=mem_G[0:S1_ind]
"""
Similarly we will create a new sub-string, which will start at the second value.
The resulting string will be like
603        422
Again, we should find the index of first space and than the
take the Used Memory and Free memory.
"""
mem_G1=mem_G[S1_ind+8:]
S2_ind=mem_G1.index(' ')
mem_U=mem_G1[0:S2_ind]

mem_F=mem_G1[S2_ind+8:]
print 'Summary = ' + mem_G
print 'Total Memory = ' + mem_T +' MB'
print 'Used Memory = ' + mem_U +' MB'
print 'Free Memory = ' + mem_F +' MB'
Чтобы получить построчный анализ памяти и времени вашей программы, я предлагаю использоватьmemory_profiler а также line_profiler.
Установка:
# Time profiler
$ pip install line_profiler
# Memory profiler
$ pip install memory_profiler
# Install the dependency for a faster analysis
$ pip install psutil
Общая часть заключается в том, что вы указываете, какую функцию хотите анализировать, используя соответствующие декораторы.
Пример: в моем файле Python есть несколько функций main.pyчто я хочу проанализировать. Один из них являетсяlinearRegressionfit(). Мне нужно использовать декоратор@profile это помогает мне профилировать код в отношении обоих: времени и памяти.
Внесите следующие изменения в определение функции
@profile
def linearRegressionfit(Xt,Yt,Xts,Yts):
    lr=LinearRegression()
    model=lr.fit(Xt,Yt)
    predict=lr.predict(Xts)
    # More Code
Для времени профилирования,
Бегать:
$ kernprof -l -v main.py
Выход
Total time: 0.181071 s
File: main.py
Function: linearRegressionfit at line 35

Line #      Hits         Time  Per Hit   % Time  Line Contents
==============================================================
    35                                           @profile
    36                                           def linearRegressionfit(Xt,Yt,Xts,Yts):
    37         1         52.0     52.0      0.1      lr=LinearRegression()
    38         1      28942.0  28942.0     75.2      model=lr.fit(Xt,Yt)
    39         1       1347.0   1347.0      3.5      predict=lr.predict(Xts)
    40
    41         1       4924.0   4924.0     12.8      print("train Accuracy",lr.score(Xt,Yt))
    42         1       3242.0   3242.0      8.4      print("test Accuracy",lr.score(Xts,Yts))
Для профилирования памяти,
Бегать:
$ python -m memory_profiler main.py
Выход
Filename: main.py

Line #    Mem usage    Increment   Line Contents
================================================
    35  125.992 MiB  125.992 MiB   @profile
    36                             def linearRegressionfit(Xt,Yt,Xts,Yts):
    37  125.992 MiB    0.000 MiB       lr=LinearRegression()
    38  130.547 MiB    4.555 MiB       model=lr.fit(Xt,Yt)
    39  130.547 MiB    0.000 MiB       predict=lr.predict(Xts)
    40
    41  130.547 MiB    0.000 MiB       print("train Accuracy",lr.score(Xt,Yt))
    42  130.547 MiB    0.000 MiB       print("test Accuracy",lr.score(Xts,Yts))
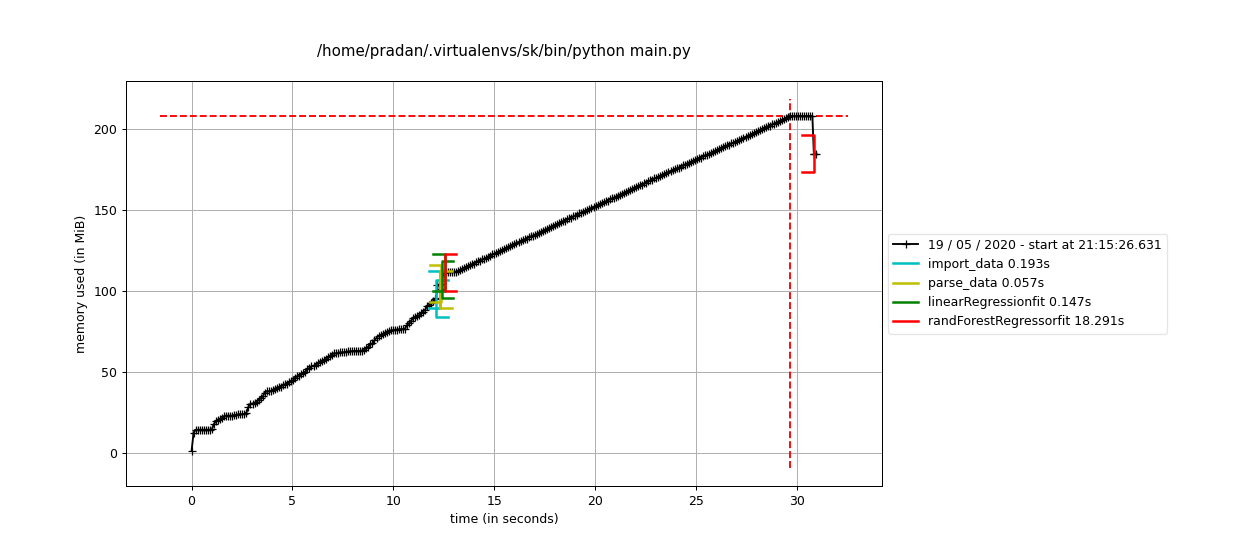
Кроме того, результаты профилировщика памяти также могут быть построены с использованием matplotlib с помощью
$ mprof run main.py
$ mprof plot
 Примечание: протестировано на
line_profiler версия == 3.0.2
memory_profiler версия == 0.57.0
psutil версия == 5.7.0
EDIT: результаты профилировщиков можно проанализировать с помощью пакета TAMPPA. Используя его, мы можем построчно получать желаемые графики как

Мы решили использовать обычный источник информации для этого, потому что мы могли найти мгновенные колебания в свободной памяти и чувствовали, что запрос источника данных meminfo был полезен. Это также помогло нам получить еще несколько связанных параметров, которые были предварительно проанализированы.
Код
import os
....
memory_usage = os.popen("cat /proc/meminfo").read()
Вывод для справки (мы удалили все новые строки для дальнейшего анализа)
MemTotal: 1014500 КБ MemFree: 562680 КБ MemAvailable: 646364 КБ Буферы: 15144 КБ Кэшированные: 210720 КБ Свопы: 0 КБ Активные: 261476 КБ Неактивные: 128888 КБ Активные (анон): 167092 КБ Неактивные (анон): файл 20888 КБ Активные (файл): 94384 КБ Неактивно (файл): 108000 КБ Неизвестно: 3652 КБ Блокировано: 3652 КБ Общий объем обмена: 0 КБ Свободный обмен: 0 КБ Грязный: 0 КБ Обратная запись: 0 КБ Количество страниц: 168160 КБ Отображено: 81352 КБ Shmem: 21060 КБ Плита: 34492 КБ SRExlaimable: 18044 кБ 0 кБ AnonHugePages: 88064 кБ CmaTotal: 0 кБ CmaFree: 0 кБ HugePages_Total: 0 HugePages_Free: 0 HugePages_Rsvd: 0 HugePages_Surp: 0 Огромный размер страницы: 2048 кБ DirectMap4k: 43008 КБ 10055 КБММ682
Вот кое-что, что я собрал некоторое время назад, это только окна, но может помочь вам получить часть того, что вам нужно сделать.
Получено из: "для sys доступно mem" http://msdn2.microsoft.com/en-us/library/aa455130.aspx
"Информация об отдельных процессах и примеры сценариев Python" http://www.microsoft.com/technet/scriptcenter/scripts/default.mspx?mfr=true
ПРИМЕЧАНИЕ. Интерфейс / процесс WMI также доступен для выполнения аналогичных задач. Я не использую его здесь, потому что текущий метод покрывает мои потребности, но если когда-нибудь потребуется его расширить или улучшить, то, возможно, захочется исследовать инструменты WMI как доступную.,
WMI для Python:
http://tgolden.sc.sabren.com/python/wmi.html
Код:
'''
Monitor window processes

derived from:
>for sys available mem
http://msdn2.microsoft.com/en-us/library/aa455130.aspx

> individual process information and python script examples
http://www.microsoft.com/technet/scriptcenter/scripts/default.mspx?mfr=true

NOTE: the WMI interface/process is also available for performing similar tasks
        I'm not using it here because the current method covers my needs, but if someday it's needed
        to extend or improve this module, then may want to investigate the WMI tools available.
        WMI for python:
        http://tgolden.sc.sabren.com/python/wmi.html
'''

__revision__ = 3

import win32com.client
from ctypes import *
from ctypes.wintypes import *
import pythoncom
import pywintypes
import datetime


class MEMORYSTATUS(Structure):
    _fields_ = [
                ('dwLength', DWORD),
                ('dwMemoryLoad', DWORD),
                ('dwTotalPhys', DWORD),
                ('dwAvailPhys', DWORD),
                ('dwTotalPageFile', DWORD),
                ('dwAvailPageFile', DWORD),
                ('dwTotalVirtual', DWORD),
                ('dwAvailVirtual', DWORD),
                ]


def winmem():
    x = MEMORYSTATUS() # create the structure
    windll.kernel32.GlobalMemoryStatus(byref(x)) # from cytypes.wintypes
    return x


class process_stats:
    '''process_stats is able to provide counters of (all?) the items available in perfmon.
    Refer to the self.supported_types keys for the currently supported 'Performance Objects'

    To add logging support for other data you can derive the necessary data from perfmon:
    ---------
    perfmon can be run from windows 'run' menu by entering 'perfmon' and enter.
    Clicking on the '+' will open the 'add counters' menu,
    From the 'Add Counters' dialog, the 'Performance object' is the self.support_types key.
    --> Where spaces are removed and symbols are entered as text (Ex. # == Number, % == Percent)
    For the items you wish to log add the proper attribute name in the list in the self.supported_types dictionary,
    keyed by the 'Performance Object' name as mentioned above.
    ---------

    NOTE: The 'NETFramework_NETCLRMemory' key does not seem to log dotnet 2.0 properly.

    Initially the python implementation was derived from:
    http://www.microsoft.com/technet/scriptcenter/scripts/default.mspx?mfr=true
    '''
    def __init__(self,process_name_list=[],perf_object_list=[],filter_list=[]):
        '''process_names_list == the list of all processes to log (if empty log all)
        perf_object_list == list of process counters to log
        filter_list == list of text to filter
        print_results == boolean, output to stdout
        '''
        pythoncom.CoInitialize() # Needed when run by the same process in a thread

        self.process_name_list = process_name_list
        self.perf_object_list = perf_object_list
        self.filter_list = filter_list

        self.win32_perf_base = 'Win32_PerfFormattedData_'

        # Define new datatypes here!
        self.supported_types = {
                                    'NETFramework_NETCLRMemory':    [
                                                                        'Name',
                                                                        'NumberTotalCommittedBytes',
                                                                        'NumberTotalReservedBytes',
                                                                        'NumberInducedGC',
                                                                        'NumberGen0Collections',
                                                                        'NumberGen1Collections',
                                                                        'NumberGen2Collections',
                                                                        'PromotedMemoryFromGen0',
                                                                        'PromotedMemoryFromGen1',
                                                                        'PercentTimeInGC',
                                                                        'LargeObjectHeapSize'
                                                                     ],

                                    'PerfProc_Process':              [
                                                                          'Name',
                                                                          'PrivateBytes',
                                                                          'ElapsedTime',
                                                                          'IDProcess',# pid
                                                                          'Caption',
                                                                          'CreatingProcessID',
                                                                          'Description',
                                                                          'IODataBytesPersec',
                                                                          'IODataOperationsPersec',
                                                                          'IOOtherBytesPersec',
                                                                          'IOOtherOperationsPersec',
                                                                          'IOReadBytesPersec',
                                                                          'IOReadOperationsPersec',
                                                                          'IOWriteBytesPersec',
                                                                          'IOWriteOperationsPersec'
                                                                      ]
                                }

    def get_pid_stats(self, pid):
        this_proc_dict = {}

        pythoncom.CoInitialize() # Needed when run by the same process in a thread
        if not self.perf_object_list:
            perf_object_list = self.supported_types.keys()

        for counter_type in perf_object_list:
            strComputer = "."
            objWMIService = win32com.client.Dispatch("WbemScripting.SWbemLocator")
            objSWbemServices = objWMIService.ConnectServer(strComputer,"root\cimv2")

            query_str = '''Select * from %s%s''' % (self.win32_perf_base,counter_type)
            colItems = objSWbemServices.ExecQuery(query_str) # "Select * from Win32_PerfFormattedData_PerfProc_Process")# changed from Win32_Thread

            if len(colItems) > 0:
                for objItem in colItems:
                    if hasattr(objItem, 'IDProcess') and pid == objItem.IDProcess:

                            for attribute in self.supported_types[counter_type]:
                                eval_str = 'objItem.%s' % (attribute)
                                this_proc_dict[attribute] = eval(eval_str)

                            this_proc_dict['TimeStamp'] = datetime.datetime.now().strftime('%Y-%m-%d %H:%M:%S.') + str(datetime.datetime.now().microsecond)[:3]
                            break

        return this_proc_dict


    def get_stats(self):
        '''
        Show process stats for all processes in given list, if none given return all processes
        If filter list is defined return only the items that match or contained in the list
        Returns a list of result dictionaries
        '''
        pythoncom.CoInitialize() # Needed when run by the same process in a thread
        proc_results_list = []
        if not self.perf_object_list:
            perf_object_list = self.supported_types.keys()

        for counter_type in perf_object_list:
            strComputer = "."
            objWMIService = win32com.client.Dispatch("WbemScripting.SWbemLocator")
            objSWbemServices = objWMIService.ConnectServer(strComputer,"root\cimv2")

            query_str = '''Select * from %s%s''' % (self.win32_perf_base,counter_type)
            colItems = objSWbemServices.ExecQuery(query_str) # "Select * from Win32_PerfFormattedData_PerfProc_Process")# changed from Win32_Thread

            try:
                if len(colItems) > 0:
                    for objItem in colItems:
                        found_flag = False
                        this_proc_dict = {}

                        if not self.process_name_list:
                            found_flag = True
                        else:
                            # Check if process name is in the process name list, allow print if it is
                            for proc_name in self.process_name_list:
                                obj_name = objItem.Name
                                if proc_name.lower() in obj_name.lower(): # will log if contains name
                                    found_flag = True
                                    break

                        if found_flag:
                            for attribute in self.supported_types[counter_type]:
                                eval_str = 'objItem.%s' % (attribute)
                                this_proc_dict[attribute] = eval(eval_str)

                            this_proc_dict['TimeStamp'] = datetime.datetime.now().strftime('%Y-%m-%d %H:%M:%S.') + str(datetime.datetime.now().microsecond)[:3]
                            proc_results_list.append(this_proc_dict)

            except pywintypes.com_error, err_msg:
                # Ignore and continue (proc_mem_logger calls this function once per second)
                continue
        return proc_results_list


def get_sys_stats():
    ''' Returns a dictionary of the system stats'''
    pythoncom.CoInitialize() # Needed when run by the same process in a thread
    x = winmem()

    sys_dict = {
                    'dwAvailPhys': x.dwAvailPhys,
                    'dwAvailVirtual':x.dwAvailVirtual
                }
    return sys_dict


if __name__ == '__main__':
    # This area used for testing only
    sys_dict = get_sys_stats()

    stats_processor = process_stats(process_name_list=['process2watch'],perf_object_list=[],filter_list=[])
    proc_results = stats_processor.get_stats()

    for result_dict in proc_results:
        print result_dict

    import os
    this_pid = os.getpid()
    this_proc_results = stats_processor.get_pid_stats(this_pid)

    print 'this proc results:'
    print this_proc_results
http://monkut.webfactional.com/blog/archive/2009/1/21/windows-process-memory-logging-python
Я чувствую, что эти ответы были написаны для Python 2, и в любом случае никто не упомянул стандарт resource Пакет, который доступен для Python 3. Он предоставляет команды для получения лимитов ресурсов для данного процесса (вызывающий процесс Python по умолчанию). Это не то же самое, что текущее использование ресурсов системой в целом, но это может решить некоторые из тех же проблем, например, например: "Я хочу убедиться, что я использую только много памяти ОЗУ с этим сценарием".
Это совокупность всех вкусностей:
psutil +
os чтобы получить совместимость с Unix и Windows: Это позволяет нам получить:
- Процессор
- объем памяти
- диск
код:
      import os
import psutil  # need: pip install psutil

In [32]: psutil.virtual_memory()
Out[32]: svmem(total=6247907328, available=2502328320, percent=59.9, used=3327135744, free=167067648, active=3671199744, inactive=1662668800,     buffers=844783616, cached=1908920320, shared=123912192, slab=613048320)

In [33]: psutil.virtual_memory().percent
Out[33]: 60.0

In [34]: psutil.cpu_percent()
Out[34]: 5.5

In [35]: os.sep
Out[35]: '/'

In [36]: psutil.disk_usage(os.sep)
Out[36]: sdiskusage(total=50190790656, used=41343860736, free=6467502080, percent=86.5)

In [37]: psutil.disk_usage(os.sep).percent
Out[37]: 86.5
Получил отзывы из первого ответа и внес небольшие изменения
            #!/usr/bin/env python
            #Execute commond on windows machine to install psutil>>>>python -m pip install psutil
            import psutil

            print ('                                                                   ')
            print ('----------------------CPU Information summary----------------------')
            print ('                                                                   ')

            # gives a single float value
            vcc=psutil.cpu_count()
            print ('Total number of CPUs :',vcc)

            vcpu=psutil.cpu_percent()
            print ('Total CPUs utilized percentage :',vcpu,'%')

            print ('                                                                   ')
            print ('----------------------RAM Information summary----------------------')
            print ('                                                                   ')
            # you can convert that object to a dictionary
            #print(dict(psutil.virtual_memory()._asdict()))
            # gives an object with many fields
            vvm=psutil.virtual_memory()

            x=dict(psutil.virtual_memory()._asdict())

            def forloop():
                for i in x:
                    print (i,"--",x[i]/1024/1024/1024)#Output will be printed in GBs

            forloop()
            print ('                                                                   ')
            print ('----------------------RAM Utilization summary----------------------')
            print ('                                                                   ')
            # you can have the percentage of used RAM
            print('Percentage of used RAM :',psutil.virtual_memory().percent,'%')
            #79.2
            # you can calculate percentage of available memory
            print('Percentage of available RAM :',psutil.virtual_memory().available * 100 / psutil.virtual_memory().total,'%')
            #20.8
"... текущее состояние системы (текущий процессор, оперативная память, свободное место на диске и т. д.)" И "*nix и платформы Windows" могут оказаться трудной комбинацией.
Операционные системы принципиально отличаются тем, как они управляют этими ресурсами. Действительно, они различаются по основным понятиям, таким как определение того, что считается системой, а что - временем приложения.
"Свободное место на диске"? Что считается "дисковым пространством"? Все разделы всех устройств? А как насчет внешних разделов в мультизагрузочной среде?
Я не думаю, что существует достаточно четкий консенсус между Windows и * nix, который делает это возможным. Действительно, между различными операционными системами, называемыми Windows, может и не быть единого мнения. Существует ли единый Windows API, который работает как для XP, так и для Vista?
Этот скрипт для использования процессора:
import os

def get_cpu_load():
    """ Returns a list CPU Loads"""
    result = []
    cmd = "WMIC CPU GET LoadPercentage "
    response = os.popen(cmd + ' 2>&1','r').read().strip().split("\r\n")
    for load in response[1:]:
       result.append(int(load))
    return result

if __name__ == '__main__':
    print get_cpu_load()
Для деталей процессора используйте библиотеку psutil
Для частоты RAM (в МГц) используйте встроенную в Linux библиотеку dmidecode и немного манипулируйте выводом;). эта команда требует прав суперпользователя, поэтому укажите и ваш пароль. просто скопируйте следующий комментарий, заменив mypass своим паролем
import osos.system("echo mypass | sudo -S dmidecode -t memory | grep 'Clock Speed' | cut -d ':' -f2")------------------- Выход ---------------------------
1600 тонн / с
неизвестный
1600 тонн / с
Неизвестный 0
- более конкретно
[i for i in os.popen("echo mypass | sudo -S dmidecode -t memory | grep 'Clock Speed' | cut -d ':' -f2").read().split(' ') if i.isdigit()]
-------------------------- выход ----------------------- -
['1600', '1600']
Вы можете прочитать /proc/meminfo, чтобы использовать память
file1 = open('/proc/meminfo', 'r')

for line in file1:
    if 'MemTotal' in line:
        x = line.split()
        memTotal = int(x[1])

    if 'Buffers' in line:
        x = line.split()
        buffers = int(x[1])

    if 'Cached' in line and 'SwapCached' not in line:
        x = line.split()
        cached = int(x[1])

    if 'MemFree' in line:
        x = line.split()
        memFree = int(x[1])

file1.close()

percentage_used = int ( ( memTotal - (buffers + cached + memFree) ) / memTotal * 100 )
print(percentage_used)
Вы можете использовать psutil или psmem с примером кода подпроцесса
import subprocess
cmd =   subprocess.Popen(['sudo','./ps_mem'],stdout=subprocess.PIPE,stderr=subprocess.PIPE)
out,error = cmd.communicate()
memory = out.splitlines()
Ссылка http://techarena51.com/index.php/how-to-install-python-3-and-flask-on-linux/
Вы всегда можете использовать недавно выпущенную библиотекуSystemScripterс помощью командыpip install SystemScripter. Это библиотека, которая использует другую библиотеку, напримерpsutilсреди прочего, для создания полной библиотеки системной информации, которая охватывает информацию от процессора до информации о диске. Для текущего использования ЦП используйте функцию:
SystemScripter.CPU.CpuPerCurrentUtil(SystemScripter.CPU()) #class init as self param if not work
Это получает процент использования или использование:
SystemScripter.CPU.CpuCurrentUtil(SystemScripter.CPU())
Основываясь на коде использования процессора @Hrabal, вот что я использую:
from subprocess import Popen, PIPE

def get_cpu_usage():
    ''' Get CPU usage on Linux by reading /proc/stat '''

    sub = Popen(('grep', 'cpu', '/proc/stat'), stdout=PIPE, stderr=PIPE)
    top_vals = [int(val) for val in sub.communicate()[0].split('\n')[0].split[1:5]]

    return (top_vals[0] + top_vals[2]) * 100. /(top_vals[0] + top_vals[2] + top_vals[3])
Оболочка не требуется для решения user5203370 , поэтому предполагается, что стандартные библиотеки Linux и Python:
      def cpu_load():
    with open("/proc/stat", "r") as stat:
        (key, user, nice, system, idle, _) = (stat.readline().split(None, 5))
    assert key == "cpu", "'cpu ...' should be the first line in /proc/stat"
    busy = int(user) + int(nice) + int(system)
    return 100 * busy / (busy + int(idle))
Запуск с crontab не печатает pid
Настраивать:
*/1 * * * * sh dog.sh эта строка в
crontab -e
      import os
import re

CUT_OFF = 90

def get_cpu_load():
    cmd = "ps -Ao user,uid,comm,pid,pcpu --sort=-pcpu | head -n 2 | tail -1"
    response = os.popen(cmd, 'r').read()
    arr = re.findall(r'\S+', response)
    print(arr)
    needKill = float(arr[-1]) > CUT_OFF
    if needKill:
        r = os.popen(f"kill -9 {arr[-2]}")
        print('kill:', r)

if __name__ == '__main__':
    # Test CPU with
    # $ stress --cpu 1
    # crontab -e
    # Every 1 min
    # */1 * * * * sh dog.sh
    # ctlr o, ctlr x
    # crontab -l
    print(get_cpu_load())
Я не верю, что есть хорошо поддерживаемая многоплатформенная библиотека. Помните, что сам Python написан на C, поэтому любая библиотека просто примет умное решение о том, какой фрагмент кода для конкретной ОС запускать, как вы предложили выше.