Добавьте разрыв между путями круговой диаграммы в SVG
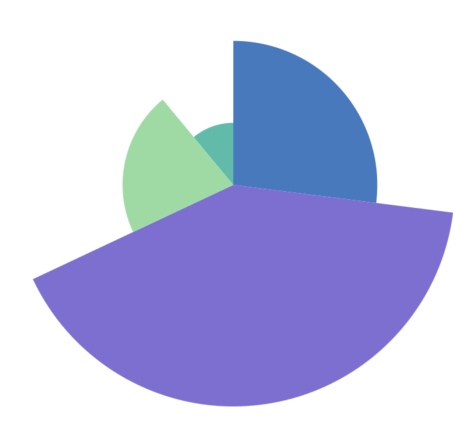
Я пытаюсь сделать круговую диаграмму через SVG с разрывом / линией между срезами, но в настоящее время я не получаю правильных результатов. Вот как это должно выглядеть.
Вот как я сделал компонент, это со ссылкой на этот средний пост.
import React from 'react';
import { View, ViewPropTypes } from 'react-native';
import PropTypes from 'prop-types';
import Svg, { Path, G } from 'react-native-svg';

import { styleHelper } from '../../../helpers';

const maxPercentage = 100;

const generateCoordinates = (percent) => {
  const a = (percent * 2 * Math.PI) / maxPercentage;
  const x = Math.cos(a);
  const y = Math.sin(a);
  return [x, y];
};

const PieChart = ({ style, data, size }) => {
  const radius = size / 2;
  const viewBox = `-${radius} -${radius} ${size} ${size}`;
  let cumulativePercent = 0;

  return (
    <View style={[style, { width: size, height: size }]}>
      <Svg
        width={size}
        height={size}
        viewBox={viewBox}
        style={{ transform: [{ rotate: '-90deg' }] }}
      >
        {data.map((slice) => {
          const largeArcFlag = slice.percent > (maxPercentage / 2) ? 1 : 0;
          const xAxisRotation = 0;
          const sweepFlag = 1;
          const scaleValue = slice.percentScale / maxPercentage;
          const [startX, startY] = generateCoordinates(cumulativePercent);
          const [endX, endY] = generateCoordinates(cumulativePercent += slice.percent);

          // Building the SVG
          const m = `M ${startX * radius} ${startY * radius}`;
          const a = (
            `A ${radius} ${radius} ${xAxisRotation} ${largeArcFlag} ${sweepFlag} ${endX * radius} ${endY * radius}`
          );
          const l = 'L 0 0';

          return (
            <G
              key={slice.id}
              transform={`scale(${scaleValue})`}
            >
              <Path
                d={`${m} ${a} ${l}`}
                fill={styleHelper.renderStyle(slice.color)}
              />
            </G>
          );
        })}
      </Svg>
    </View>
  );
};

PieChart.propTypes = {
  style: ViewPropTypes.style,
  data: PropTypes.arrayOf(PropTypes.shape({
    location: PropTypes.string,
    leads: PropTypes.number,
    percent: PropTypes.number,
    percentScale: PropTypes.number,
    color: PropTypes.string,
  })).isRequired,
  size: PropTypes.number.isRequired,
};

PieChart.defaultProps = {
  style: {},
};

export default PieChart;
В настоящее время это рендеринг круговой круговой диаграммы с срезами, масштабированными по наибольшему значению. В настоящее время нет линии / пробела, разделяющей ломтики.
Любые комментарии или предложения действительно будут ценными. Спасибо!
