Значения geom_col вышли из строя
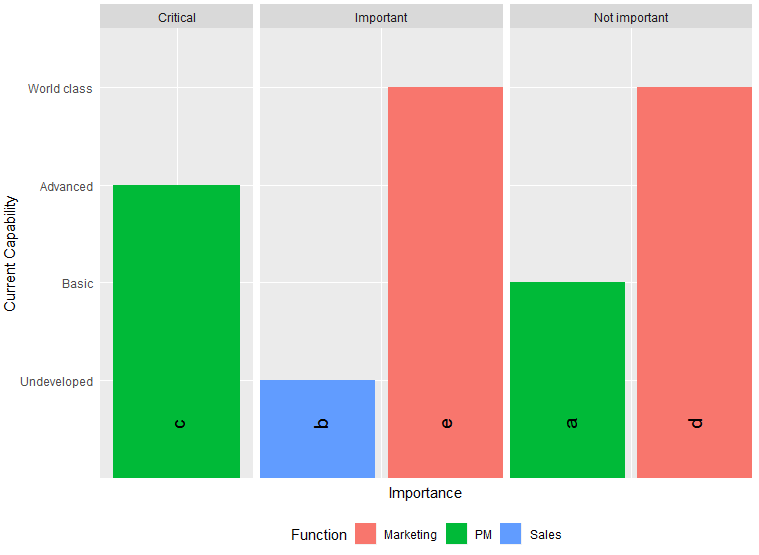
Я новичок в R. У меня проблемы с заказом geom_text элементы ниже geom_col диаграмма.
Я считаю, что это как-то связано с position = position_dodge2(preserve = "single") линия, но я не уверен.
Пример кода и выходы прилагаются. Как вы можете видеть, ярлыки неверны - e а также b должны быть переключены, а также a а также d,
Может ли кто-то с более острыми глазами (и, возможно, более острым умом) увидеть, в чем проблема?
library(ggplot2)
library(stringr)

data <- data.frame(Importance = c("Not important", "Important", "Critical", "Not important", "Important"), Current.Capability = c("Basic", "Undeveloped", "Advanced", "World class", "World class"), Function = c("PM", "Sales", "PM", "Marketing", "Marketing"), Item = c("a","b", "c", "d", "e"))

str(data)
head(data)

width <- 2
position.width <- width - 0.05

ggplot(data, aes(x = Importance, y = Current.Capability, fill=Function)) +
  geom_col(position = position_dodge2(preserve = "single"), width = width) +
  facet_grid(~Importance, scales = "free_x", space = "free_x") +
  geom_text(
    aes(
    label = stringr::str_wrap(Item, 50)),
    lineheight = 0.7,
    angle=90,
    size = 5,
    hjust=0,
    vjust=0.5,
    y = 0.5,
    position = position_dodge2(preserve = "single", width = position.width)) +
  theme(axis.text.x = element_blank(), axis.ticks = element_blank()) +
  theme(legend.position="bottom")+
  scale_y_discrete(limits = c("Undeveloped", "Basic", "Advanced", "World class")) +
  xlab("Importance") + ylab("Current Capability")
1 ответ
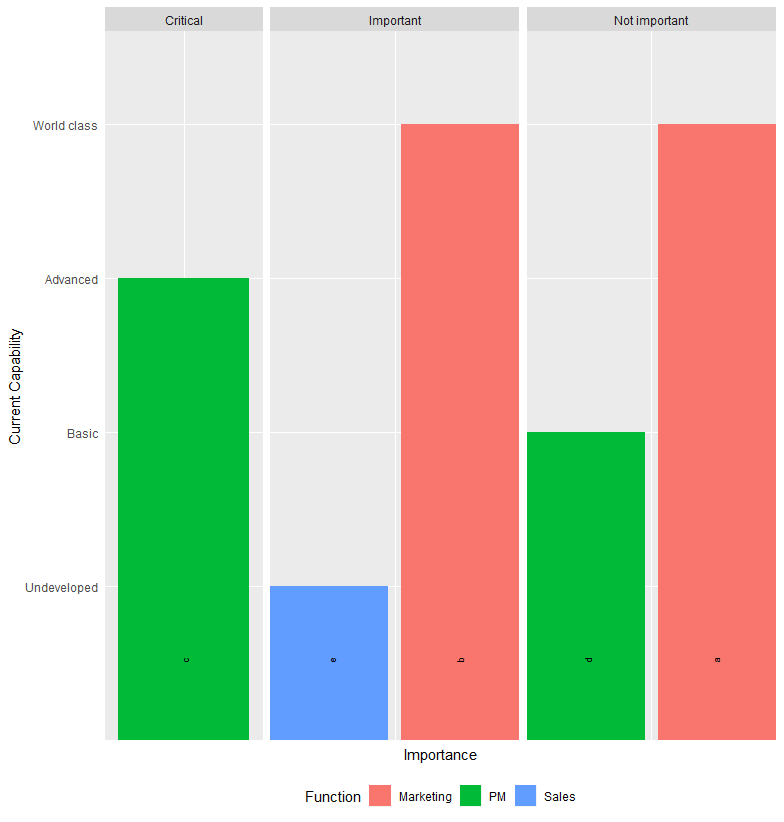
Решение
Хорошо сделано. Может быть, вы можете попробовать добавить group = Importance в эстетике geom_text, То есть, чтобы "явно определить структуру группировки", см. Группирование. Также здесь есть связанный случай.
ggplot(data, aes(x = Importance, y = Current.Capability, fill=Function)) +
  geom_col(position = position_dodge2(preserve = "single"), width = width) +
  facet_grid(~Importance, scales = "free_x", space = "free_x") +
  geom_text(
    aes(
      label = stringr::str_wrap(Item, 50),
      group = Importance), # explicitly define the grouping structure
    lineheight = 0.7,
    angle=90,
    size = 5,
    hjust=0,
    vjust=0.5,
    y = 0.5,
    position = position_dodge2(preserve = "single", width = position.width)) +
  theme(axis.text.x = element_blank(), axis.ticks = element_blank()) +
  theme(legend.position="bottom")+
  scale_y_discrete(limits = c("Undeveloped", "Basic", "Advanced", "World class")) +
  xlab("Importance") + ylab("Current Capability")