Получать цвета с шейп-файлами
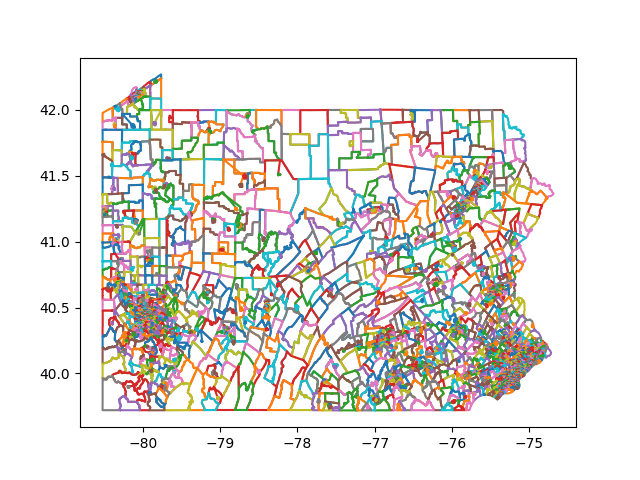
Я играю с шейп-файлами переписей ПА. Получил это на работу, и это выходит очень хорошо, как это. 
Но я действительно хочу цвета. Например, скажем, я хочу, чтобы все тракты заполняли цветом, а не белым?
мои коды ниже
#https://chrishavlin.com/2016/11/16/shapefiles-tutorial/
#https://gis.stackexchange.com/questions/131716/plot-shapefile-with-matplotlib
#https://stackru.com/questions/30447790/displaying-a-shapefile/48056459#48056459
import shapefile
import numpy as np
from matplotlib import pyplot as plt
from descartes import PolygonPatch
sf = shapefile.Reader('/ws/redisticting_game/python/shapefiles/tr42_d00')
#first feature of the shapefile
print(f'number of shapes imported:{len(sf.shapes())}')


plt.figure()
t =plt.gca()

for shape in list(sf.iterShapes()):


    npoints = len(shape.points)
    nparts = len(shape.parts)
    poly = shape.__geo_interface__
    t.add_patch(PolygonPatch(poly, fc='#ffffff', ec='#000000', alpha=0.5, zorder=2 ))
    t.axis('scaled')
    if nparts == 1:
        x_lon = np.zeros((len(shape.points),1))
        y_lat = np.zeros((len(shape.points),1))
        for ip in range(len(shape.points)):
            x_lon[ip] = shape.points[ip][0]
            y_lat[ip] = shape.points[ip][1]
        plt.plot(x_lon,y_lat)
    else:
        for ip in range(nparts):
            i0=shape.parts[ip]
            if ip < nparts-1:
                i1 = shape.parts[ip+1]-1
            else:
                i1 = npoints
            seg = shape.points[i0:i1+1]
            x_lon = np.zeros((len(seg),1))
            y_lat = np.zeros((len(seg),1))
            for ip in range(len(seg)):
                x_lon[ip] = seg[ip][0]
                y_lat[ip] = seg[ip][1]

        plt.plot(x_lon,y_lat,color = 'r')
plt.show()