geom_tile и facet_grid/facet_wrap для одинаковой высоты плиток
Используя ggplot, я хотел бы представить плитку графика с панелью, но с плиткой одинаковой высоты для каждой панели. У меня есть этот график:
dataSta <- list(sites=rep(paste("S", 1:31),each=12), month=rep(1:12,31), value=round(runif(31*12, min=0, max=3000)), panel=c(rep("Group 1",16*12),rep("Group 2", 12*12), rep("Group 3", 3*12)))
library(ggplot2)
library(grid)
base_size <- 9
windows()
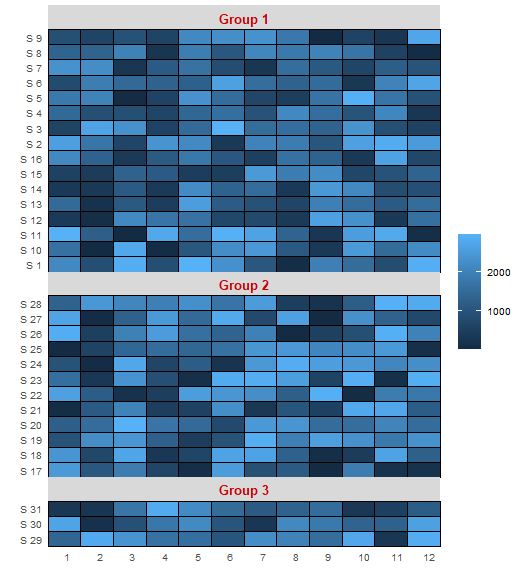
ggplot(data.frame(dataSta), aes(factor(month), sites)) +
geom_tile(aes(fill = value), colour = "black")+
facet_wrap(~panel, scale="free_y", nrow=3)+
theme_grey(base_size = base_size) +
labs(x = "",y = "") +
scale_x_discrete(expand = c(0, 0)) +
scale_y_discrete(expand = c(0, 0)) +
theme(legend.title = element_blank(),
axis.ticks = element_blank(),
axis.text.x = element_text(size = base_size *0.8, hjust = 0),
panel.margin = unit(0,"lines"),
strip.text = element_text(colour="red3", size=10, face=2))
Но высота плитки отличается между панелями. Я пытаюсь использовать facet_grid:
windows()
ggplot(data.frame(dataSta), aes(factor(month), sites)) +
  geom_tile(aes(fill = value), colour = "black")+
  facet_grid(panel~., scales="free_y", space="free")+
  theme_grey(base_size = base_size) +
  labs(x = "",y = "") +
  scale_x_discrete(expand = c(0, 0)) +
  scale_y_discrete(expand = c(0, 0)) +
  theme(legend.title = element_blank(),
        axis.ticks = element_blank(),
        axis.text.x = element_text(size = base_size *0.8, hjust = 0),
        panel.margin = unit(0,"lines"),
        strip.text = element_text(colour="red3", size=10, face=2))
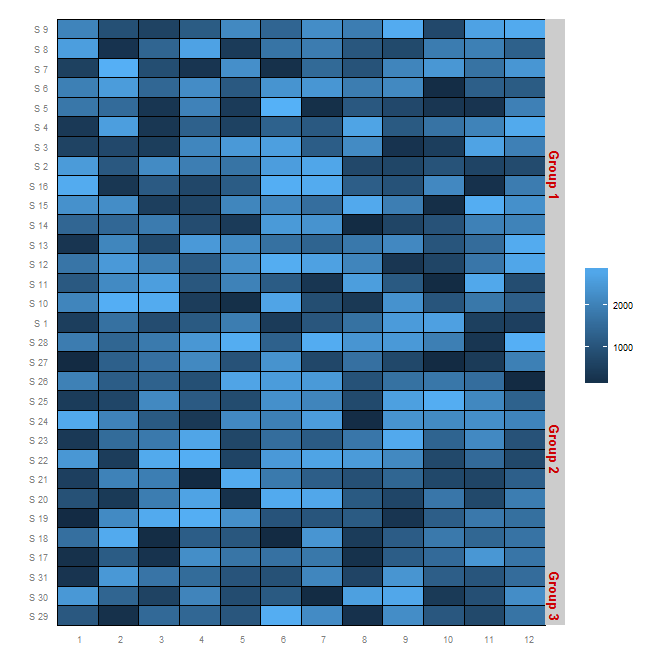 Проблема с высотой плитки устранена, но метки панели (Группа 1 ... Группа 3) не находятся сверху панели. Можно ли изменить положение меток панели с помощью facet_grid? или объединить facet_grid и facet_wrap? Спасибо за вашу помощь, и извините за мой английский!
3 ответа
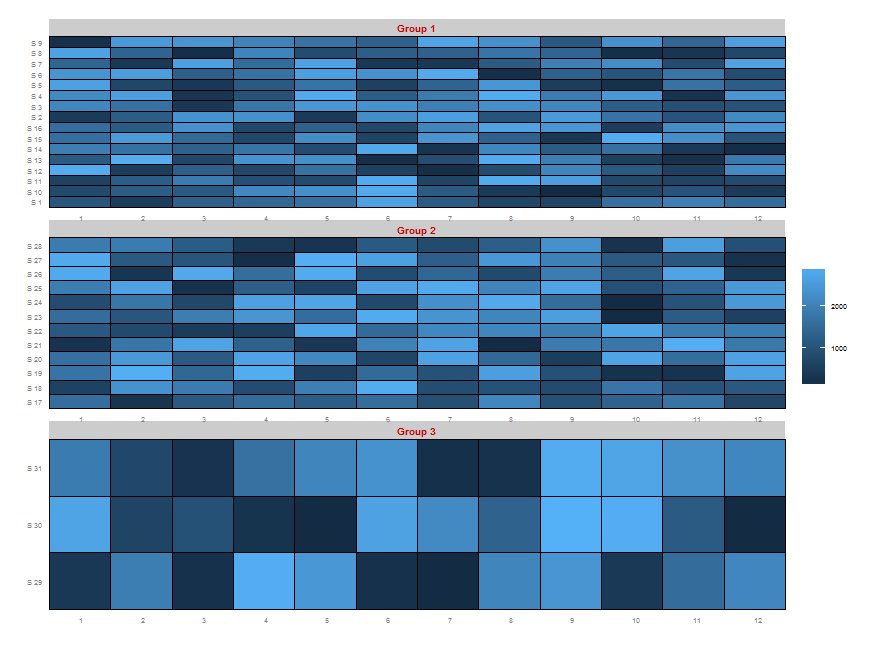
Вы можете посмотреть, что содержит ggplot, прежде чем строить, и соответственно изменить масштаб панелей.
g <- ggplot_build(p)
## find out how many y-breaks are in each panel
## to infer the number of tiles
vtiles <- sapply(lapply(g$panel$ranges, "[[", "y.major"), length)

## convert the plot to a gtable object
gt <- ggplot_gtable(g)
## find out which items in the layout correspond to the panels
## we refer to the "t" (top) index of the layout
panels <- gt$layout$t[grepl("panel", gt$layout$name)]
## replace the default panel heights (1null) with relative sizes
## null units scale relative to each other, so we scale with the number of tiles
gt$heights[panels] <-lapply(vtiles, unit, "null")
## draw on a clean slate
library(grid)
grid.newpage()
grid.draw(gt)

Мне потребовалось некоторое время, чтобы найти более простое решение, которое на самом деле является частью facet_grid где вы можете установить space = "free_y", Больше информации на недавнем вопросе.
В
ggforceВ пакете есть небольшая удобная функция, называемая. Не нужно возиться с
grid упаковка!
Все, что вам нужно сделать, это заменить звонок на
facet_grid с соответствующими
facet_col альтернатива:
      library(ggplot2)
library(ggforce)

dataSta <- list(sites=rep(paste("S", 1:31),each=12),
month=rep(1:12,31), value=round(runif(31*12, min=0, max=3000)),
panel=c(rep("Group 1",16*12),rep("Group 2", 12*12), rep("Group 3", 3*12)))

base_size <- 9

ggplot(data.frame(dataSta), aes(factor(month), sites)) +
  geom_tile(aes(fill = value), colour = "black") +

  # Here's the line to alter:
  facet_col(vars(panel), , scales = "free_y", space = "free") +

  theme_grey(base_size = base_size) +
  labs(x = "",y = "") +
  scale_x_discrete(expand = c(0, 0)) +
  scale_y_discrete(expand = c(0, 0)) +
  theme(legend.title = element_blank(),
        axis.ticks = element_blank(),
        axis.text.x = element_text(size = base_size *0.8, hjust = 0),
        panel.spacing = unit(0,"lines"),
        strip.text = element_text(colour="red3", size=10, face=2))