mapview для блестящего
Я создаю интерактивную карту, используя mapView
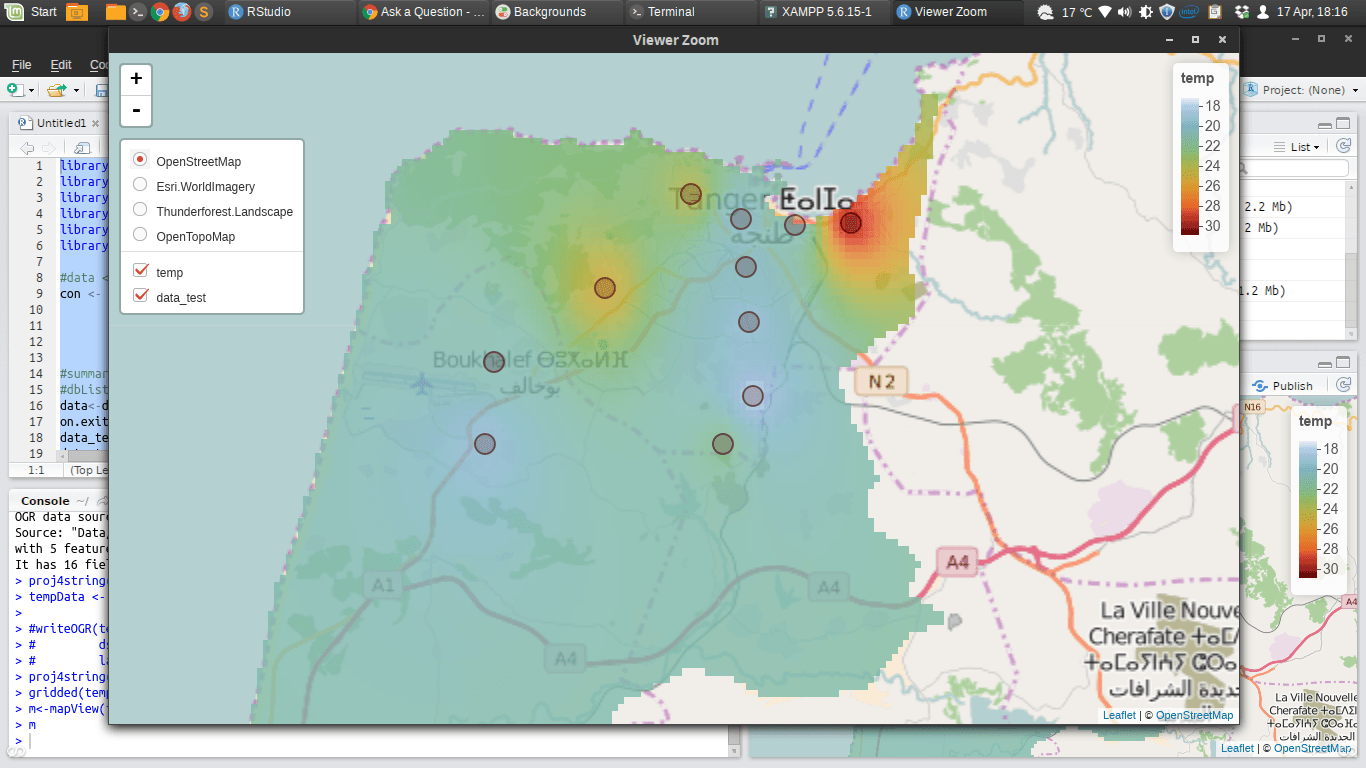
mapview() функция отлично работает с данными в сетке (SpatialPixelsDataFrame):
Код:
library(sp)
library(ggplot2)
library(gstat)
library(rgdal)
library(mapview)
library(RMySQL)

con <- dbConnect(MySQL(),
                 user="root",
                 password="",
                 host="127.0.0.1",
                 dbname="rstudio")
data<-dbReadTable(con,"data")
on.exit(dbDisconnect(con))

data_test <- data
data_test$x <- data$long
data_test$y <- data$lat
coordinates(data_test) = ~x + y
x.range <- as.numeric(c(-5.99, -5.74))
y.range <- as.numeric(c(35.57, 35.81))
grd <- expand.grid(x = seq(from = x.range[1], to = x.range[2], by = 0.002),
                   y = seq(from = y.range[1], to = y.range[2], by = 0.002))  # expand points to grid
coordinates(grd) <- ~x + y
gridded(grd) <- TRUE

idw <- idw(formula = temp ~ 1, locations = data_test, newdata = grd)
idw.output = as.data.frame(idw)  # output is defined as a data table

names(idw.output)[1:3] <- c("long", "lat", "temp")
idw.output <- idw.output[,1:3]

coordinates(idw.output) <- ~long+lat
morocco <- readOGR("Data/morocco/TNG", "TNG")
proj4string(idw.output)<-proj4string(morocco)
tempData <- idw.output[morocco,]
proj4string(data_test)<-proj4string(morocco)
gridded(tempData) <- TRUE
m<-mapView(tempData, zcol = "temp") + data_test
m
Результат:
Сейчас
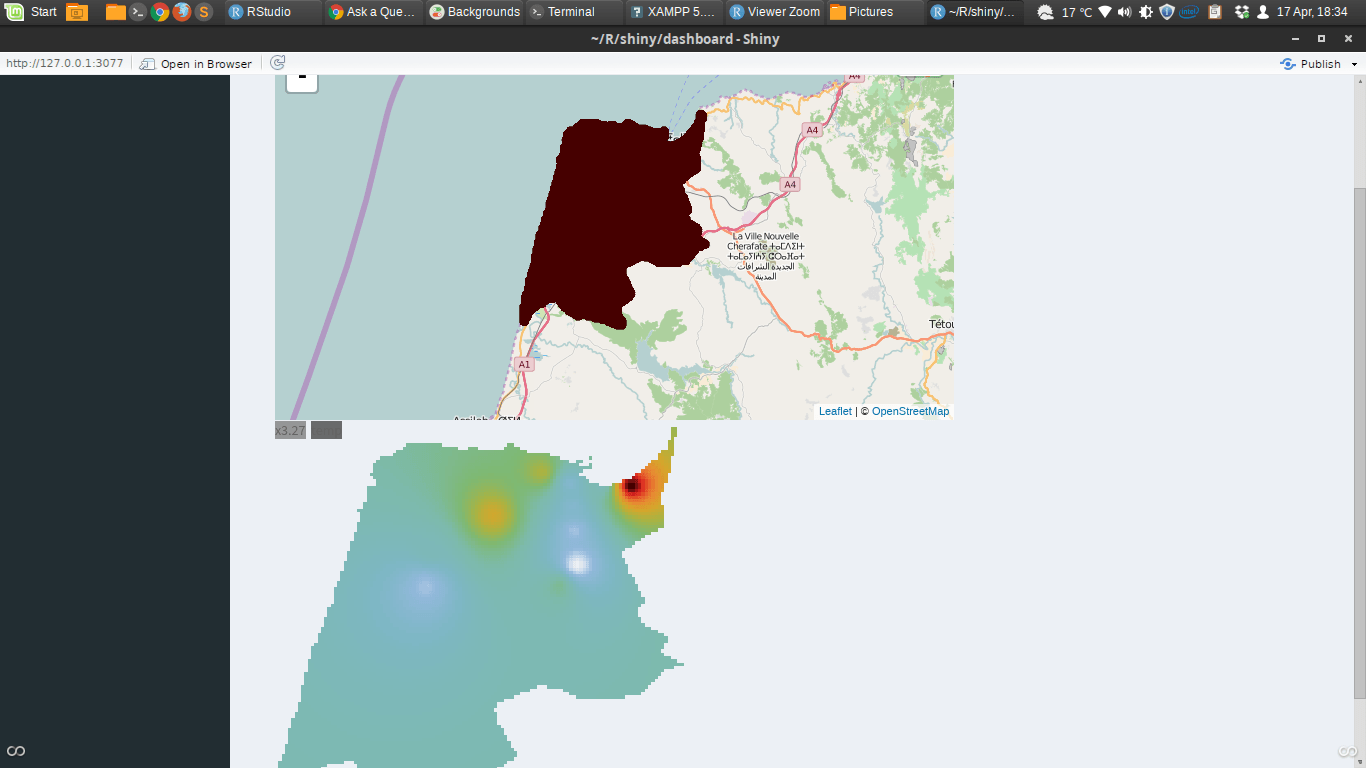
Я хочу перейти на блестящий, проблема в том, что нет функции рендеринга для просмотра карты. Я пытался использовать fpView() bView(), но безрезультатно.
Моя попытка с Shiny
Код:
ui.R
library(shiny)
library(shinydashboard)
library(mapview)

header <- dashboardHeader(title="Ardusky")

sidebar <- dashboardSidebar(
)

body <- dashboardBody(
  # Define UI for application
  fluidPage(
    mainPanel(
      mapview:::fpViewOutput("mapplot"),
      mapview:::plainViewOutput("test")
    ))
)

ui <- dashboardPage(header, sidebar, body, skin="black")
server.R
library(shiny)
library(mapview)
library(ggplot2)
library(sp)
library(gstat)
library(rgdal)
library(RMySQL)

shinyServer(function(input, output, session) {

  repInput <- reactive({
                    con <- dbConnect(MySQL(),
                                     user="root",
                                     password="",
                                     host="127.0.0.1",
                                     dbname="rstudio")
                    data<-dbReadTable(con,"data")
                    on.exit(dbDisconnect(con))
                    data_test <- data
                    data_test$x <- data$long
                    data_test$y <- data$lat
                    coordinates(data_test) = ~x + y
                    x.range <- as.numeric(c(-5.99, -5.74))
                    y.range <- as.numeric(c(35.57, 35.81))
                    grd <- expand.grid(x = seq(from = x.range[1], to = x.range[2], by = 0.002),
                                       y = seq(from = y.range[1], to = y.range[2], by = 0.002))  # expand points to grid
                    coordinates(grd) <- ~x + y
                    gridded(grd) <- TRUE
                    idw <- idw(formula = temp ~ 1, locations = data_test, newdata = grd)
                    idw.output = as.data.frame(idw)  # output is defined as a data table
                    names(idw.output)[1:3] <- c("long", "lat", "temp")
                    idw.output <- idw.output[,1:3]
                    coordinates(idw.output) <- ~long+lat
                    morocco <- readOGR("/home/bloodesu/Data/morocco/TNG", "TNG")
                    proj4string(idw.output)<-proj4string(morocco)
                    tempData <- idw.output[morocco,]
                    proj4string(data_test)<-proj4string(morocco)
                    gridded(tempData) <- TRUE
                    tempData
  })

  output$mapplot <- mapview:::renderfpView({
    mapview:::fpView(repInput(), zcol = "temp")
  })

  output$test <- mapview:::renderPlainView({
    mapview:::plainview(repInput(), zcol = "temp")
  })


})
Результат
Заключение
Как видите, только plainView дает приемлемые результаты, но без поддержки листовок.
1 ответ
MapView и блестящие не созданы друг для друга. Тем не менее, mapview основан на листовке, поэтому мы можем использовать блестящую поддержку из листовки. Хитрость заключается в том, чтобы настроить объект карты с помощью mapview, а затем вызвать @map прорезь (часть листовки) внутри renderLeaflet()
ui.R
library(shiny)
library(shinydashboard)
library(mapview)

header <- dashboardHeader(title="Ardusky")

sidebar <- dashboardSidebar(
)

body <- dashboardBody(
  # Define UI for application
  fluidPage(
    mainPanel(
      leafletOutput("mapplot"),
      mapview:::plainViewOutput("test")
    ))
)

ui <- dashboardPage(header, sidebar, body, skin="black")
server.ui
library(shiny)
library(mapview)
library(sp)

shinyServer(function(input, output, session) {

  data(meuse)
  coordinates(meuse) <- ~x+y
  proj4string(meuse) <- CRS("+init=epsg:28992")

  data(meuse.grid)
  coordinates(meuse.grid) <- ~x+y
  proj4string(meuse.grid) <- CRS("+init=epsg:28992")
  gridded(meuse.grid) <- TRUE

  m <- mapview(meuse.grid, zcol = "dist") + meuse

  output$mapplot <- renderLeaflet({
    m@map
  })

})
Решает ли это вашу проблему?
ОБНОВЛЕНИЕ: я только что добавил mapviewOutput а также renderMapview к версии разработки на github. Это означает, что теперь мы можем пропустить явный вызов @map слот объекта карты. Так что-то вроде output$mapplot <- renderMapview(m) должен работать сейчас.
Разрабатываемая версия mapview может быть установлена с devtools::install_github("environmentalinformatics-marburg/mapview", ref = "develop")
ОБНОВЛЕНИЕ (2018/04/01): renderMapview а также mapviewOutput на данный момент не работают! Таким образом, призывая renderLeaflet({ m@map }) в настоящее время способ использовать mapview с блестящим.

