Matplotlib: другой масштаб на отрицательной стороне оси
Фон
Я пытаюсь показать три переменные на одном графике. Я соединил три точки, используя линии разных цветов на основе некоторых других переменных. Это показано здесь 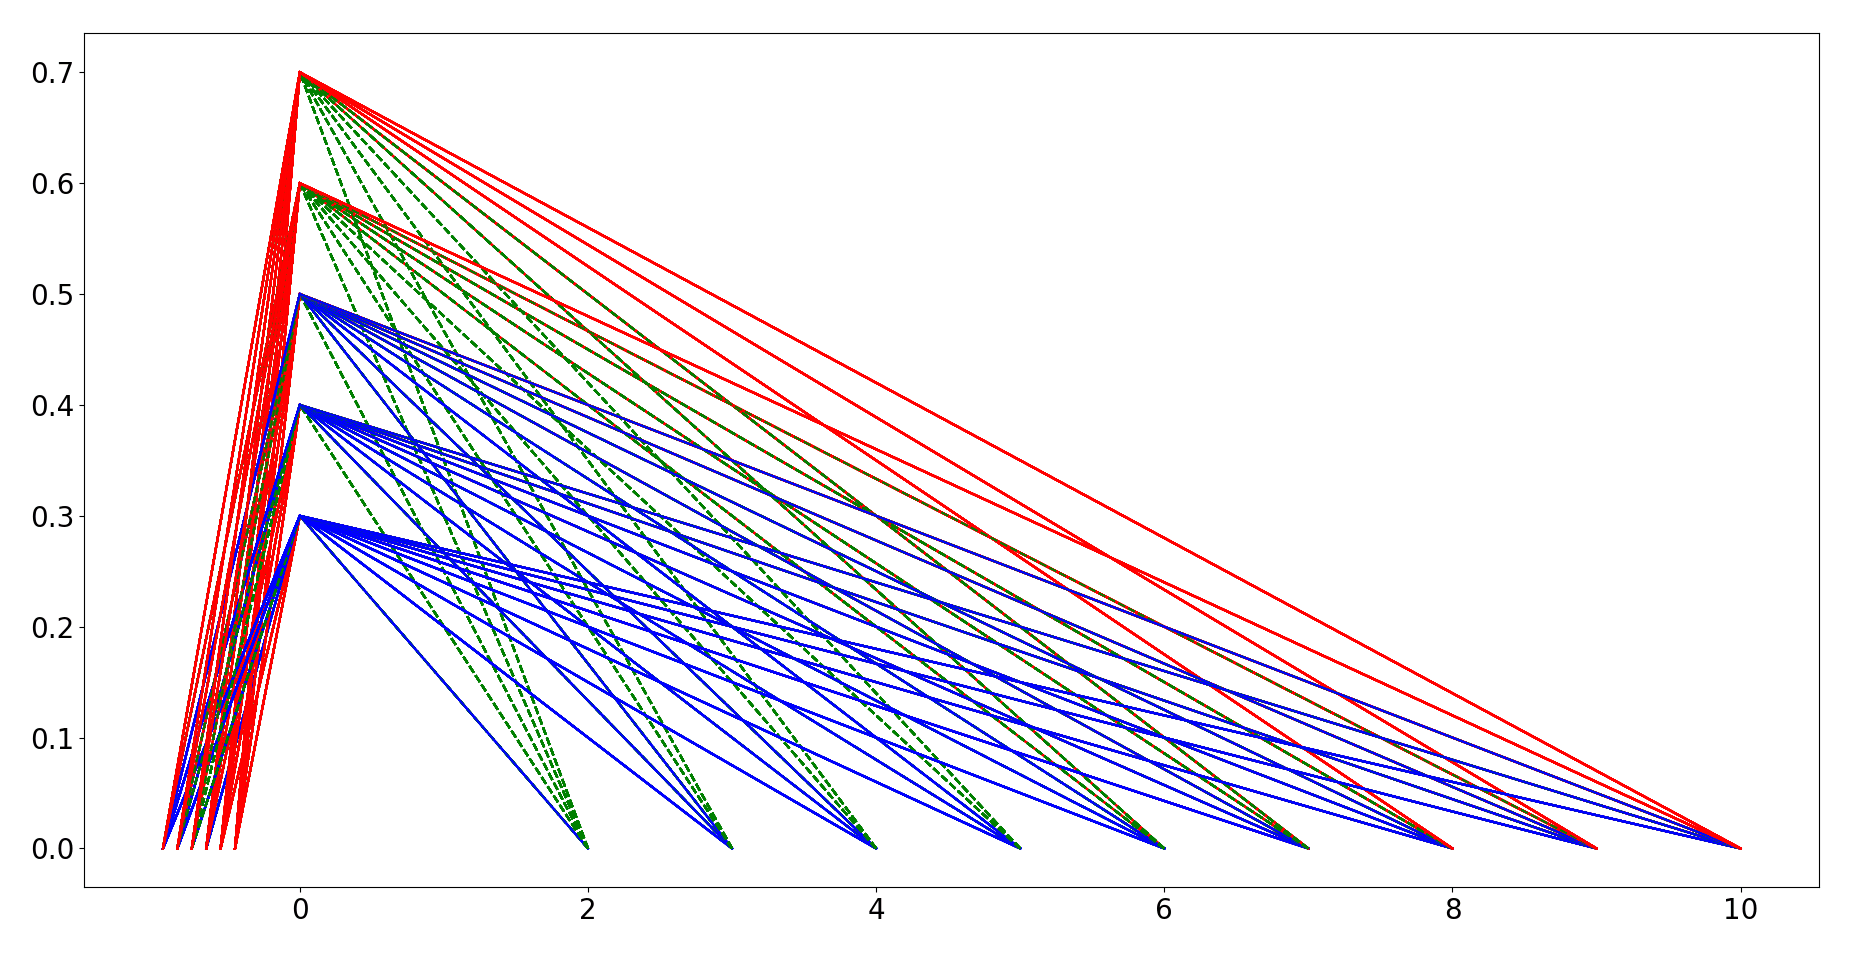
проблема
То, что я хочу сделать, это иметь другой масштаб на отрицательной оси X. Это помогло бы мне предоставить положительные x_ticks, другую метку оси, а также четкое и незагроможденное представление линий на левой стороне изображения
Вопрос
- Как получить другую положительную ось X, начинающуюся от 0 в направлении отрицательного направления?
- Иметь xticks на основе данных, нанесенных в этом направлении
- Есть отдельный xlabel для этой новой оси
Дополнительная информация
Я проверил другие вопросы, касающиеся включения нескольких осей, например, это и это. Однако эти вопросы не служили цели.
Используемый код
font_size = 20
plt.rcParams.update({'font.size': font_size})

fig = plt.figure()
ax = fig.add_subplot(111)
#read my_data from file or create it

for case in my_data:

    #Iterating over my_data

    if condition1 == True:
        local_linestyle = '-'
        local_color = 'r'
        local_line_alpha = 0.6
    elif condition2 == 1:
        local_linestyle = '-'
        local_color = 'b'
        local_line_alpha = 0.6
    else:
        local_linestyle = '--'
        local_color = 'g'
        local_line_alpha = 0.6

    datapoint = [case[0], case[1], case[2]]

    plt.plot(datapoint[0], 0, color=local_color)
    plt.plot(-datapoint[2], 0, color=local_color)
    plt.plot(0, datapoint[1], color=local_color)
    plt.plot([datapoint[0], 0], [0, datapoint[1]], linestyle=local_linestyle, color=local_color)
    plt.plot([-datapoint[2], 0], [0, datapoint[1]], linestyle=local_linestyle, color=local_color)
plt.show()
exit()
2 ответа
Вы можете определить пользовательский масштаб, где значения ниже нуля масштабируются иначе, чем значения выше нуля.
import numpy as np
from matplotlib import scale as mscale
from matplotlib import transforms as mtransforms
from matplotlib.ticker import FuncFormatter

class AsymScale(mscale.ScaleBase):
    name = 'asym'

    def __init__(self, axis, **kwargs):
        mscale.ScaleBase.__init__(self)
        self.a = kwargs.get("a", 1)

    def get_transform(self):
        return self.AsymTrans(self.a)

    def set_default_locators_and_formatters(self, axis):
        # possibly, set a different locator and formatter here.
        fmt = lambda x,pos: "{}".format(np.abs(x))
        axis.set_major_formatter(FuncFormatter(fmt))

    class AsymTrans(mtransforms.Transform):
        input_dims = 1
        output_dims = 1
        is_separable = True

        def __init__(self, a):
            mtransforms.Transform.__init__(self)
            self.a = a

        def transform_non_affine(self, x):
            return (x >= 0)*x + (x < 0)*x*self.a

        def inverted(self):
            return AsymScale.InvertedAsymTrans(self.a)

    class InvertedAsymTrans(AsymTrans):

        def transform_non_affine(self, x):
            return (x >= 0)*x + (x < 0)*x/self.a
        def inverted(self):
            return AsymScale.AsymTrans(self.a)
Используя это, вы предоставите параметр масштаба a это масштабирует отрицательную часть осей.
# Now that the Scale class has been defined, it must be registered so
# that ``matplotlib`` can find it.
mscale.register_scale(AsymScale)
import matplotlib.pyplot as plt
fig, ax = plt.subplots()
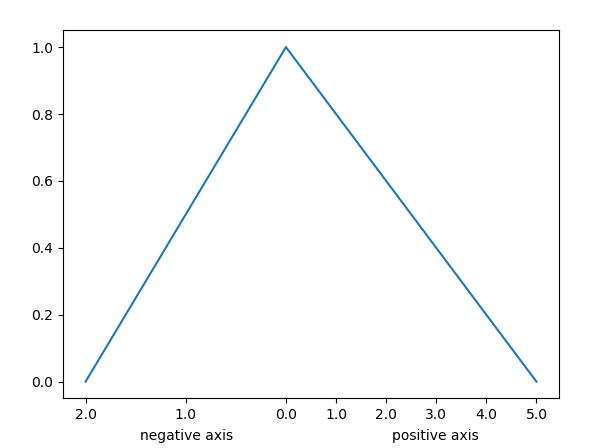
ax.plot([-2, 0, 5], [0,1,0])
ax.set_xscale("asym", a=2)
ax.annotate("negative axis", xy=(.25,0), xytext=(0,-30),
xycoords = "axes fraction", textcoords="offset points", ha="center")
ax.annotate("positive axis", xy=(.75,0), xytext=(0,-30),
xycoords = "axes fraction", textcoords="offset points", ha="center")
plt.show()
Вопрос о том, какие метки и ярлыки нужны, не очень ясен, поэтому я оставил это пока.
Вот как можно получить то, что вы хотите. Это решение использует два скрученных axes Объект получает различное масштабирование слева и справа от источника, а затем скрывает все доказательства:
import matplotlib.pyplot as plt
import matplotlib as mpl
from numbers import Number

tickkwargs = {m+k:False for k in ('bottom','top','left','right') for m in ('','label')}

p = np.zeros((10, 3, 2))
p[:,0,0] -= np.arange(10)*.1 + .5
p[:,1,1] += np.repeat(np.arange(5), 2)*.1 + .3
p[:,2,0] += np.arange(10)*.5 + 2

fig = plt.figure(figsize=(8,6))
host = fig.add_subplot(111)
par = host.twiny()

host.set_xlim(-6, 6)
par.set_xlim(-1, 1)

for ps in p:
    # mask the points with negative x values
    ppos = ps[ps[:,0] >= 0].T
    host.plot(*ppos)

    # mask the points with positive x values
    pneg = ps[ps[:,0] <= 0].T
    par.plot(*pneg)

# hide all possible ticks/notation text that could be set by the second x axis
par.tick_params(axis="both", **tickkwargs)
par.xaxis.get_offset_text().set_visible(False)

# fix the x tick labels so they're all positive
host.set_xticklabels(np.abs(host.get_xticks()))

fig.show()
Выход:
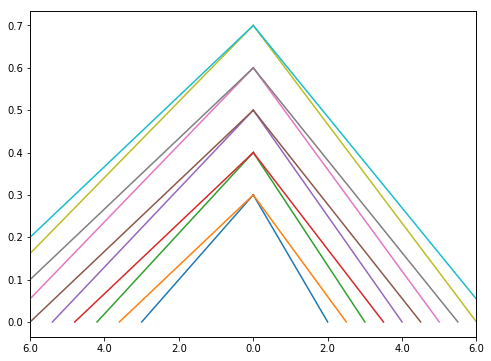
Вот что такое набор очков p Я использовал в приведенном выше коде выглядеть так, как показано на графике:
fig = plt.figure(figsize=(8,6))
ax = fig.gca()
for ps in p:
    ax.plot(*ps.T)
fig.show()
Выход:
Метод получения класса mscale.ScaleBaseкак показано в других ответах, может быть слишком сложным для вашей цели. Вы можете передать две функции масштабного преобразования вset_xscale или set_yscale, что-то вроде следующего.
def get_scale(a=1):  # a is the scale of your negative axis
    def forward(x):
        x = (x >= 0) * x + (x < 0) * x * a
        return x

    def inverse(x):
        x = (x >= 0) * x + (x < 0) * x / a
        return x

    return forward, inverse

fig, ax = plt.subplots()

forward, inverse = get_scale(a=3)
ax.set_xscale('function', functions=(forward, inverse))  # this is for setting x axis

# do plotting
Больше примеров можно найти в этом документе.