Разный цвет для каждого столбца в гистограмме; ChartJS
Я использую ChartJS в проекте, над которым я работаю, и мне нужен свой цвет для каждой гистограммы.
Вот пример набора данных гистограммы:
var barChartData = {
  labels: ["001", "002", "003", "004", "005", "006", "007"],
  datasets: [{
    label: "My First dataset",
    fillColor: "rgba(220,220,220,0.5)",
    strokeColor: "rgba(220,220,220,0.8)",
    highlightFill: "rgba(220,220,220,0.75)",
    highlightStroke: "rgba(220,220,220,1)",
    data: [20, 59, 80, 81, 56, 55, 40]
  }]
};
Есть ли способ покрасить каждую полосу по-разному?
22 ответа
После просмотра файла Chart.Bar.js мне удалось найти решение. Я использовал эту функцию для генерации случайного цвета:
function getRandomColor() {
    var letters = '0123456789ABCDEF'.split('');
    var color = '#';
    for (var i = 0; i < 6; i++ ) {
        color += letters[Math.floor(Math.random() * 16)];
    }
    return color;
}
Я добавил его в конец файла и вызвал эту функцию прямо внутри "fillColor:" под
helpers.each(dataset.data,function(dataPoint,index){
                    //Add a new point for each piece of data, passing any required data to draw.
так что теперь это выглядит так:
helpers.each(dataset.data,function(dataPoint,index){
                    //Add a new point for each piece of data, passing any required data to draw.

                    datasetObject.bars.push(new this.BarClass({
                        value : dataPoint,
                        label : data.labels[index],
                        datasetLabel: dataset.label,
                        strokeColor : dataset.strokeColor,
                        fillColor : getRandomColor(),
                        highlightFill : dataset.highlightFill || dataset.fillColor,
                        highlightStroke : dataset.highlightStroke || dataset.strokeColor
                    }));
                },this);
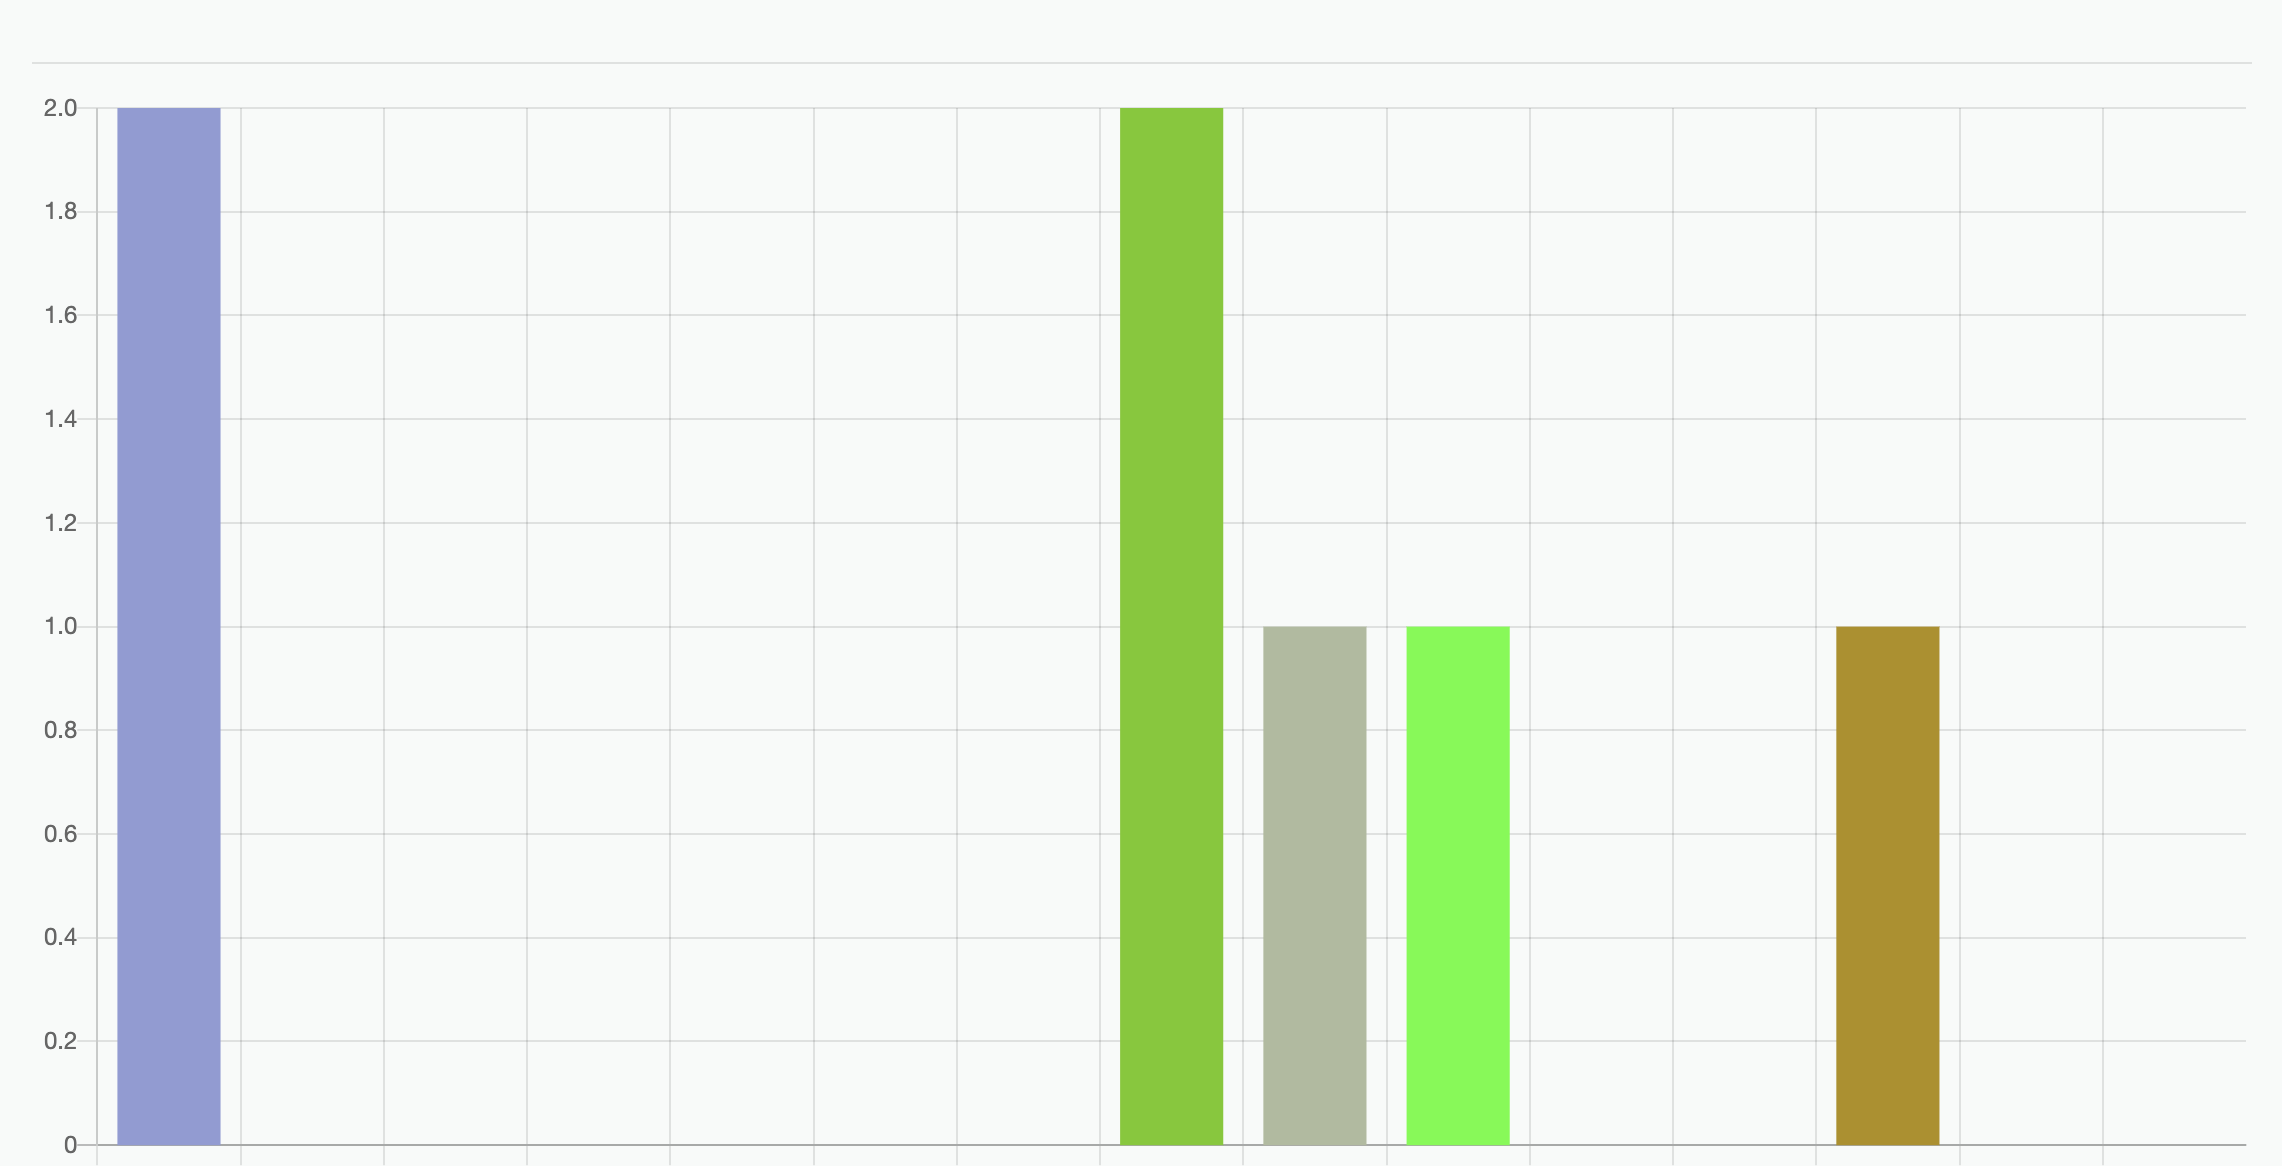
и это работает, я получаю разные цвета для каждого бара.
Начиная с версии v2, вы можете просто указать массив значений, чтобы соответствовать цвету для каждого бара через backgroundColor имущество:
datasets: [{
  label: "My First dataset",
  data: [20, 59, 80, 81, 56, 55, 40],
  backgroundColor: ["red", "blue", "green", "blue", "red", "blue"],
}],
Это также возможно для borderColor, hoverBackgroundColor, hoverBorderColor,
Из документации по свойствам набора данных линейчатой диаграммы:
Некоторые свойства могут быть указаны в виде массива. Если для них установлено значение массива, первое значение применяется к первому столбцу, второе значение - ко второму столбцу и т. Д.
Решение: вызовите метод update для установки новых значений:
var barChartData = {
    labels: ["January", "February", "March"],
    datasets: [
        {
            label: "My First dataset",
            fillColor: "rgba(220,220,220,0.5)",
            strokeColor: "rgba(220,220,220,0.8)",
            highlightFill: "rgba(220,220,220,0.75)",
            highlightStroke: "rgba(220,220,220,1)",
            data: [20, 59, 80]
        }
    ]
};

window.onload = function(){
    var ctx = document.getElementById("mycanvas").getContext("2d");
    window.myObjBar = new Chart(ctx).Bar(barChartData, {
          responsive : true
    });

    //nuevos colores
    myObjBar.datasets[0].bars[0].fillColor = "green"; //bar 1
    myObjBar.datasets[0].bars[1].fillColor = "orange"; //bar 2
    myObjBar.datasets[0].bars[2].fillColor = "red"; //bar 3
    myObjBar.update();
}
Если вы посмотрите на библиотеку " ChartNew", которая основана на Chart.js, вы можете сделать это, передавая значения в виде массива следующим образом:
var data = {
    labels: ["Batman", "Iron Man", "Captain America", "Robin"],
    datasets: [
        {
            label: "My First dataset",
            fillColor: ["rgba(220,220,220,0.5)", "navy", "red", "orange"],
            strokeColor: "rgba(220,220,220,0.8)",
            highlightFill: "rgba(220,220,220,0.75)",
            highlightStroke: "rgba(220,220,220,1)",
            data: [2000, 1500, 1750, 50]
        }
    ]
};
Вы можете вызвать эту функцию, которая генерирует случайные цвета для каждого бара
var randomColorGenerator = function () {
    return '#' + (Math.random().toString(16) + '0000000').slice(2, 8);
};

var barChartData = {
        labels: ["001", "002", "003", "004", "005", "006", "007"],
        datasets: [
            {
                label: "My First dataset",
                fillColor: randomColorGenerator(),
                strokeColor: randomColorGenerator(),
                highlightFill: randomColorGenerator(),
                highlightStroke: randomColorGenerator(),
                data: [20, 59, 80, 81, 56, 55, 40]
            }
        ]
    };
Здесь я решил эту проблему, сделав две функции. 1. dynamicColors() для генерации случайного цвета
function dynamicColors() {
var r = Math.floor(Math.random() * 255);
var g = Math.floor(Math.random() * 255);
var b = Math.floor(Math.random() * 255);
return "rgba(" + r + "," + g + "," + b + ", 0.5)";}
poolColors() для создания массива цветов
function poolColors(a) {
            var pool = [];
            for(i=0;i<a;i++){
                pool.push(dynamicColors());}
            return pool;
        }
Тогда просто передайте это
datasets: [{
            data: arrData,
            backgroundColor: poolColors(arrData.length),
            borderColor: poolColors(arrData.length),
            borderWidth: 1
        }]
По состоянию на август 2019 года в Chart.js встроена эта функциональность.
Вам просто нужно предоставить массив для backgroundColor.
Пример взят из https://www.chartjs.org/docs/latest/getting-started/
До:
  data: {
        labels: ['January', 'February', 'March', 'April', 'May', 'June', 'July'],
        datasets: [{
            label: 'My First dataset',
            backgroundColor: 'rgb(255, 99, 132)',
            borderColor: 'rgb(255, 99, 132)',
            data: [0, 10, 5, 2, 20, 30, 45]
        }]
    },
После:
  data: {
        labels: ['January', 'February', 'March', 'April', 'May', 'June', 'July'],
        datasets: [{
            label: 'My First dataset',
            backgroundColor: ['rgb(255, 99, 132)','rgb(0, 255, 0)','rgb(255, 99, 132)','rgb(128, 255, 0)','rgb(0, 255, 255)','rgb(255, 255, 0)','rgb(255, 255, 128)'],
            borderColor: 'rgb(255, 99, 132)',
            data: [0, 10, 5, 2, 20, 30, 45]
        }]
    },
Я только что проверил этот метод, и он работает. Каждая полоса имеет свой цвет.
Генерировать случайные цвета;
function getRandomColor() {
        var letters = '0123456789ABCDEF'.split('');
        var color = '#';
        for (var i = 0; i < 6; i++) {
            color += letters[Math.floor(Math.random() * 16)];
        }
        return color;
    }
и вызвать его для каждой записи;
function getRandomColorEachEmployee(count) {
        var data =[];
        for (var i = 0; i < count; i++) {
            data.push(getRandomColor());
        }
        return data;
    }
наконец установить цвета;
var data = {
            labels: jsonData.employees,// your labels
            datasets: [
                {
                    data: jsonData.approvedRatios,// your data
                    backgroundColor: getRandomColorEachEmployee(jsonData.employees.length)
                }
            ]
        };
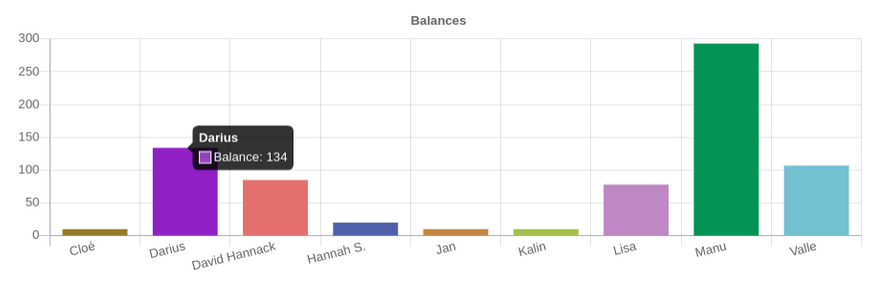
Вот способ генерировать последовательные случайные цвета с помощью цветового хеша
const colorHash = new ColorHash()

const datasets = [{
  label: 'Balance',
  data: _.values(balances),
  backgroundColor: _.keys(balances).map(name => colorHash.hex(name))
}]
Вот как я поступил: я выдвинул массив "colors", с тем же количеством записей, что и количество данных. Для этого я добавил функцию "getRandomColor" в конце скрипта. Надеюсь, поможет...
for(var i in arr) {
        customers.push(arr[i].customer);
        nb_cases.push(arr[i].nb_cases);
        colors.push(getRandomColor());
        }

     window.onload = function() {
    var config = {
    type: 'pie',
    data: {
        labels: customers,
        datasets: [{
            label: "Nomber of cases by customers",
            data: nb_cases,
            fill: true,
            backgroundColor: colors
            }]
    },
    options: {
        responsive: true,
        title:{
        display:true,
        text:"Cases by customers"
        },
    }
    };


var ctx = document.getElementById("canvas").getContext("2d");
window.myLine = new Chart(ctx, config);
};


function getRandomColor() {
    var letters = '0123456789ABCDEF'.split('');
    var color = '#';
    for (var i = 0; i < 6; i++ ) {
        color += letters[Math.floor(Math.random() * 16)];
    }
    return color;
}
Код на основе следующего запроса на извлечение:
datapoint.color = 'hsl(' + (360 * index / data.length) + ', 100%, 50%)';
Если вы не можете использовать NewChart.js, вам просто нужно изменить способ установки цвета с помощью массива. Найдите вспомогательную итерацию внутри Chart.js:
Заменить эту строку:
fillColor : dataset.fillColor,
Для этого:
fillColor : dataset.fillColor[index],
Полученный код:
//Iterate through each of the datasets, and build this into a property of the chart
  helpers.each(data.datasets,function(dataset,datasetIndex){

    var datasetObject = {
      label : dataset.label || null,
      fillColor : dataset.fillColor,
      strokeColor : dataset.strokeColor,
      bars : []
    };

    this.datasets.push(datasetObject);

    helpers.each(dataset.data,function(dataPoint,index){
      //Add a new point for each piece of data, passing any required data to draw.
      datasetObject.bars.push(new this.BarClass({
        value : dataPoint,
        label : data.labels[index],
        datasetLabel: dataset.label,
        strokeColor : dataset.strokeColor,
        //Replace this -> fillColor : dataset.fillColor,
        // Whith the following:
        fillColor : dataset.fillColor[index],
        highlightFill : dataset.highlightFill || dataset.fillColor,
        highlightStroke : dataset.highlightStroke || dataset.strokeColor
      }));
    },this);

  },this);
И в твоих js:
datasets: [
                {
                  label: "My First dataset",
                  fillColor: ["rgba(205,64,64,0.5)", "rgba(220,220,220,0.5)", "rgba(24,178,235,0.5)", "rgba(220,220,220,0.5)"],
                  strokeColor: "rgba(220,220,220,0.8)",
                  highlightFill: "rgba(220,220,220,0.75)",
                  highlightStroke: "rgba(220,220,220,1)",
                  data: [2000, 1500, 1750, 50]
                }
              ]
Попробуй это:
  function getChartJs() {
        **var dynamicColors = function () {
            var r = Math.floor(Math.random() * 255);
            var g = Math.floor(Math.random() * 255);
            var b = Math.floor(Math.random() * 255);
            return "rgb(" + r + "," + g + "," + b + ")";
        }**

        $.ajax({
            type: "POST",
            url: "ADMIN_DEFAULT.aspx/GetChartByJenisKerusakan",
            data: "{}",
            contentType: "application/json; charset=utf-8",
            dataType: "json",
            success: function (r) {
                var labels = r.d[0];
                var series1 = r.d[1];
                var data = {
                    labels: r.d[0],
                    datasets: [
                        {
                            label: "My First dataset",
                            data: series1,
                            strokeColor: "#77a8a8",
                            pointColor: "#eca1a6"
                        }
                    ]
                };

                var ctx = $("#bar_chart").get(0).getContext('2d');
                ctx.canvas.height = 300;
                ctx.canvas.width = 500;
                var lineChart = new Chart(ctx).Bar(data, {
                    bezierCurve: false,
                    title:
                      {
                          display: true,
                          text: "ProductWise Sales Count"
                      },
                    responsive: true,
                    maintainAspectRatio: true
                });

                $.each(r.d, function (key, value) {
                    **lineChart.datasets[0].bars[key].fillColor = dynamicColors();
                    lineChart.datasets[0].bars[key].fillColor = dynamicColors();**
                    lineChart.update();
                });
            },
            failure: function (r) {
                alert(r.d);
            },
            error: function (r) {
                alert(r.d);
            }
        });
    }
Это работает для меня в текущей версии 2.7.1:
function colorizePercentageChart(myObjBar) {

var bars = myObjBar.data.datasets[0].data;
console.log(myObjBar.data.datasets[0]);
for (i = 0; i < bars.length; i++) {

    var color = "green";

    if(parseFloat(bars[i])  < 95){
        color = "yellow";
    }
    if(parseFloat(bars[i])  < 50){
         color = "red";
    }

    console.log(color);
    myObjBar.data.datasets[0].backgroundColor[i] = color;

}
myObjBar.update();
}
Если вы знаете, какие цвета вы хотите, вы можете указать свойства цвета в массиве, например так:
    backgroundColor: [
    'rgba(75, 192, 192, 1)',
    ...
    ],
    borderColor: [
    'rgba(75, 192, 192, 1)',
    ...
    ],
Если взять другой ответ, вот быстрое решение, если вы хотите получить список со случайными цветами для каждой панели:
function getRandomColor(n) {
    var letters = '0123456789ABCDEF'.split('');
    var color = '#';
    var colors = [];
    for(var j = 0; j < n; j++){
        for (var i = 0; i < 6; i++ ) {
            color += letters[Math.floor(Math.random() * 16)];
        }
        colors.push(color);
        color = '#';
    }
    return colors;
}
Теперь вы можете использовать эту функцию в поле backgroundColor в данных:
data: {
        labels: count[0],
        datasets: [{
            label: 'Registros en BDs',
            data: count[1],
            backgroundColor: getRandomColor(count[1].length)
        }]
}
Что я сделал, так это создал генератор случайных цветов, как многие здесь предложили
function dynamicColors() {
        var r = Math.floor(Math.random() * 255);
        var g = Math.floor(Math.random() * 255);
        var b = Math.floor(Math.random() * 255);
        return "rgba(" + r + "," + g + "," + b + ", 0.5)";
    }
а затем закодировал это
var chartContext = document.getElementById('line-chart');
    let lineChart = new Chart(chartContext, {
        type: 'bar',
        data : {
            labels: <?php echo json_encode($names); ?>,
            datasets: [{
                data : <?php echo json_encode($salaries); ?>,
                borderWidth: 1,
                backgroundColor: dynamicColors,
            }]
        }
        ,
        options: {
            scales: {
                yAxes: [{
                    ticks: {
                        beginAtZero: true
                    }
                }]
            },
            responsive: true,
            maintainAspectRatio: false,
        }
    });
Обратите внимание, что при вызове функции нет скобок. Это позволяет коду вызывать функцию каждый раз, а не создавать массив. Это также предотвращает использование кода одного цвета для всех полос.
Следуя этому ответу: /questions/41175735/raznyij-tsvet-dlya-kazhdogo-stolbtsa-v-gistogramme-chartjs/41175768#41175768, это то, что я придумал для создания согласованных цветов, которые не меняются при каждом обновлении:
      const generateColorHue = (colorI: number, totalColors: number) => {
    const step = 360 / totalColors;
    const hue = Math.round(colorI * step);

    return hue;
};

// ...
datasets: this.platforms.map((platform, i) => {
    const hue = generateColorHue(i, this.platforms.length);
    return {
        label: platform,
        borderColor: "hsl(" + hue + ", 50%, 40%)",
        backgroundColor: "hsla(" + hue + ", 50%, 90%, .2)",
    };
}),
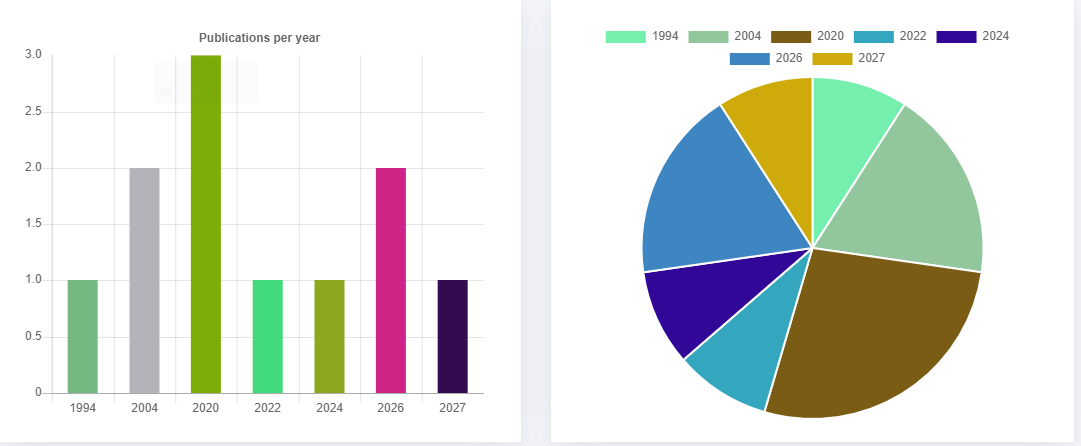
      function getRandomColor() {

        const colors = [];
        var obj = @json($year);
        const length = Object.keys(obj).length;
        for(let j=0; j<length; j++ )
        {
            const letters = '0123456789ABCDEF'.split('');
            let color = '#';
            for (let i = 0; i < 6; i++ ) {
                color += letters[Math.floor(Math.random() * 16)];
            }
            colors.push(color);
        }
        return colors;
    }
используйте эту функцию для разных цветов
Я только что получил эту проблему недавно, и вот мое решение
var labels = ["001", "002", "003", "004", "005", "006", "007"];
var data = [20, 59, 80, 81, 56, 55, 40];
for (var i = 0, len = labels.length; i < len; i++) {
   background_colors.push(getRandomColor());// I use @Benjamin method here
}

var barChartData = {
  labels: labels,
  datasets: [{
    label: "My First dataset",
    fillColor: "rgba(220,220,220,0.5)",
    strokeColor: "rgba(220,220,220,0.8)",
    highlightFill: "rgba(220,220,220,0.75)",
    highlightStroke: "rgba(220,220,220,1)",
    backgroundColor: background_colors,
    data: data
  }]
};
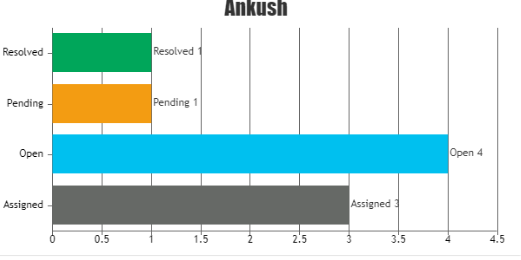
Передайте параметр цвета в dataPoints, как показано ниже, для каждого столбца:
{y: your value, label: your value, color: your color code}
Вы можете легко создавать с графиками livegap
Выберите Mulicolors из меню бара
http://charts.livegap.com/Gallery/images/Chart-14.png
** используемая библиотека диаграмм - модифицированная версия chartnew.js библиотеки chart.js
с кодом chartnew.js будет примерно так
var barChartData = {
        labels: ["001", "002", "003", "004", "005", "006", "007"],
        datasets: [
            {
                label: "My First dataset",
                fillColor: ["rgba(0,10,220,0.5)","rgba(220,0,10,0.5)","rgba(220,0,0,0.5)","rgba(120,250,120,0.5)" ],
                strokeColor: "rgba(220,220,220,0.8)",
                highlightFill: "rgba(220,220,220,0.75)",
                highlightStroke: "rgba(220,220,220,1)",
                data: [20, 59, 80, 81, 56, 55, 40]
            }
        ]
    };