Gnuplot: график рассеяния и плотность
У меня есть x- и y-данные, представляющие звездное скопление. Я хочу визуализировать плотность, используя Gnuplot и его функцию разброса с перекрывающимися точками.
Я использовал следующие команды:
 set style fill transparent solid 0.04 noborder
 set style circle radius 0.01
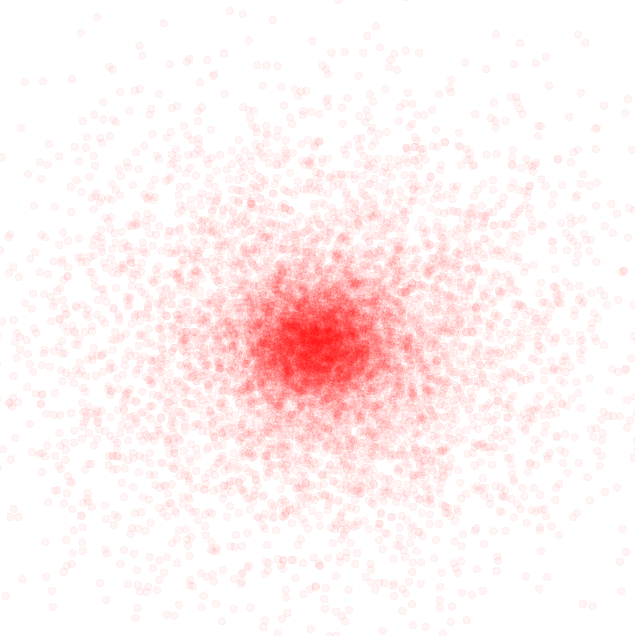
 plot "data.dat" u 1:2 with circles lc rgb "red"
Результат:
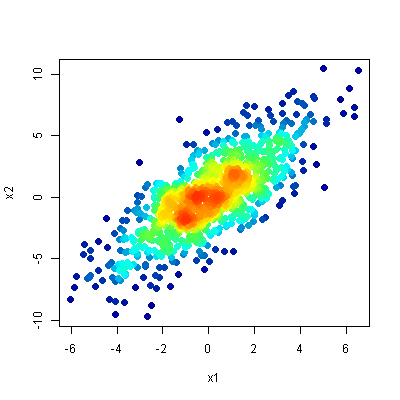
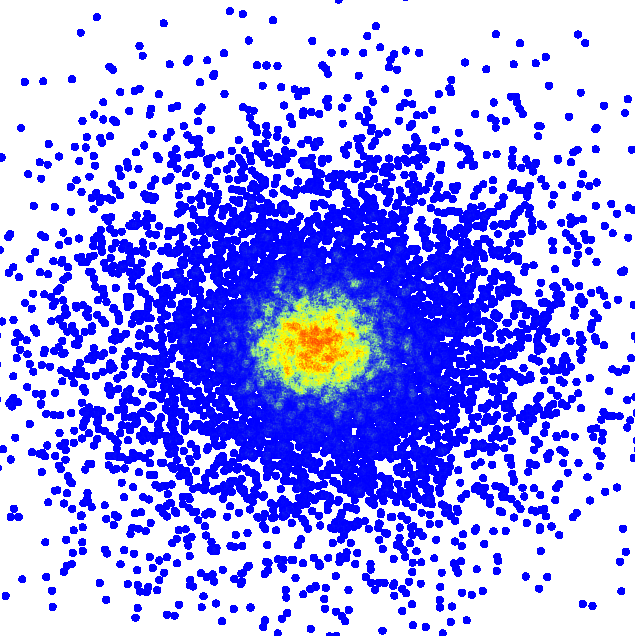
Однако я хочу что-то подобное
Это возможно в Gnuplot? Есть идеи?
1 ответ
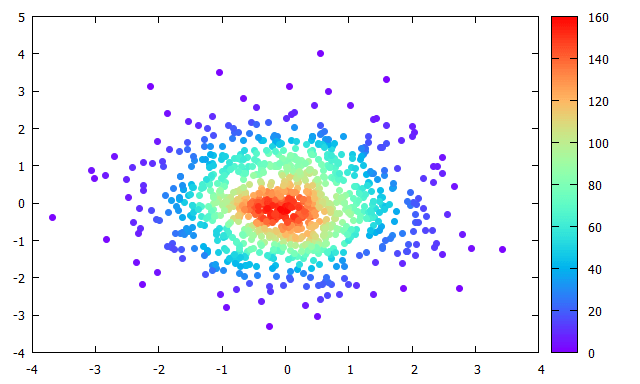
Вероятно, гораздо лучше, чем мой предыдущий ответ, заключается в следующем. На моем 8-летнем компьютере это займет около 2-3 минут за 1000 очков. Вы можете сделать то же самое для 3D (см. /questions/16513364/kak-postroit-xyz-tochki-pokazyivayuschie-ih-plotnost/16513376#16513376)
Код:
### density color plot 2D
reset session

N = 1000     # number of datapoints
Delta = 0.5    # half boxwidth

TimeStart = time(0.0)
# create some dummy datablock with some distribution
set table $Data
    set samples N
    plot '+' u (invnorm(rand(0))):(invnorm(rand(0))) w table
unset table
print sprintf("Data generated: %.3f sec",time(0.0)-TimeStart)
# end creating dummy data

TimeStart = time(0.0)
# put the datafile/dataset into arrays
stats $Data nooutput
RowCount = STATS_records
array ColX[RowCount]
array ColY[RowCount]
array ColC[RowCount]
do for [i=1:RowCount] {
set table $Dummy
    plot $Data u (ColX[$0+1]=$1,0):(ColY[$0+1]=$2,0) with table
unset table
}
print sprintf("Data put into arrays: %.3f sec",time(0.0)-TimeStart)


# look at each datapoint and its sourrounding
do for [i=1:RowCount] {
    # print sprintf("Datapoint %g of %g",i,RowCount)
    x0 = ColX[i]
    y0 = ColY[i]
    # count the datapoints with distances <Delta around the datapoint of interest
    set table $Occurrences
        plot $Data u ((abs(x0-$1)<Delta) & (abs(y0-$2)<Delta) ? 1 : 0):(1) smooth frequency
    unset table
    # extract the number from $Occurrences which will be used to color the datapoint
    set table $Dummmy
        plot $Occurrences u (c0=$2,0):($0) every ::1::1 with table
    unset table
    ColC[i] = c0
}

# put the arrays into a dataset again
set print $Data
do for [i=1:RowCount] {
    print sprintf("%g\t%g\t%g",ColX[i],ColY[i],ColC[i])
}
set print
print sprintf("Duration: %.3f sec",time(0.0)-TimeStart)

set palette rgb 33,13,10
plot $Data u 1:2:3 w p ps 1 pt 7 lc palette z notitle
### end of code
приведет к чему-то вроде:
Будет ли вариант постобработки изображения с помощью imagemagick?
# convert into a gray scale image
convert source.png -colorspace gray -sigmoidal-contrast 10,50% gray.png

# build the gradient, the heights have to sum up to 256
convert -size 10x1  gradient:white-white white.png
convert -size 10x85 gradient:red-yellow \
                    gradient:yellow-lightgreen \
                    gradient:lightgreen-blue \
        -append gradient.png
convert gradient.png white.png -append full-gradient.png

# finally convert the picture
convert gray.png full-gradient.png -clut target.png
Я не пробовал, но я совершенно уверен, что gnuplot может построить изображение в градациях серого напрямую.
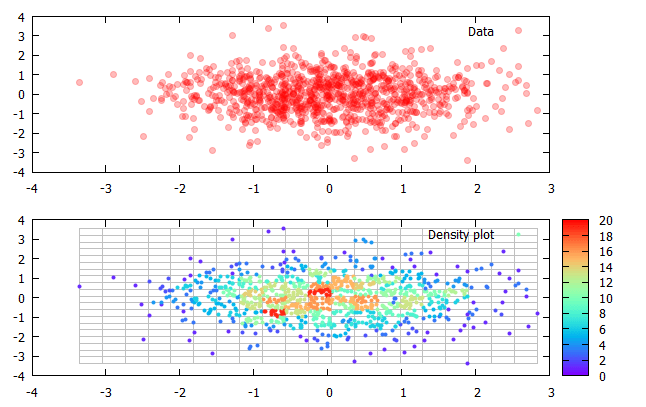
Хотя этот вопрос довольно "старый", и проблема могла быть решена по-другому... Вероятно, это больше для любопытства и веселья, чем для практических целей. Следующий код реализует раскраску в соответствии с плотностью точек, используя только gnuplot. На моем старом компьютере требуется несколько минут, чтобы построить 1000 точек. Мне было бы интересно, если этот код может быть улучшен, особенно с точки зрения скорости (без использования внешних инструментов). Жаль, что gnuplot не предлагает базовых функций, таких как сортировка, просмотр таблиц, объединение, транспонирование или другие базовые функции (я знаю... это gnuPLOT... а не инструмент анализа).
Код:
### density color plot 2D
reset session

# create some dummy datablock with some distribution
N = 1000
set table $Data
    set samples N
    plot '+' u (invnorm(rand(0))):(invnorm(rand(0))) w table
unset table
# end creating dummy data

stats $Data u 1:2 nooutput
XMin = STATS_min_x
XMax = STATS_max_x
YMin = STATS_min_y
YMax = STATS_max_y
XRange = XMax-XMin
YRange = YMax-YMin
XBinCount = 20
YBinCount = 20
BinNo(x,y) = floor((y-YMin)/YRange*YBinCount)*XBinCount + floor((x-XMin)/XRange*XBinCount)

# do the binning
set table $Bins
    plot $Data u (BinNo($1,$2)):(1) smooth freq # with table
unset table

# prepare final data: BinNo, Sum, XPos, YPos
set print $FinalData
do for [i=0:N-1] {
    set table $Data3
    plot $Data u (BinNumber = BinNo($1,$2),$1):(XPos = $1,$1):(YPos = $2,$2) every ::i::i with table
    plot [BinNumber:BinNumber+0.1] $Bins u (BinNumber == $1 ? (PointsInBin = $2,$2) : NaN) with table
    print sprintf("%g\t%g\t%g\t%g", XPos, YPos, BinNumber, PointsInBin)
    unset table
}
set print

# plot data
set multiplot layout 2,1
set rmargin at screen 0.85
plot $Data u 1:2 w p pt 7 lc rgb "#BBFF0000" t "Data"
set xrange restore # use same xrange as previous plot
set yrange restore
set palette rgbformulae 33,13,10
set colorbox
# draw the bin borders
do for [i=0:XBinCount] {
    XBinPos = i/real(XBinCount)*XRange+XMin
    set arrow from  XBinPos,YMin to XBinPos,YMax nohead lc rgb "grey" dt 1
}
do for [i=0:YBinCount] {
    YBinPos = i/real(YBinCount)*YRange+YMin
    set arrow from  XMin,YBinPos to XMax,YBinPos nohead lc rgb "grey" dt 1
}

plot $FinalData u 1:2:4 w p pt 7 ps 0.5 lc palette z t "Density plot"
unset multiplot
### end of code
Результат:
