Рисование синусоиды на холсте
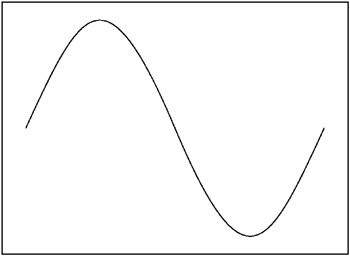
Я пытаюсь нарисовать простую синусоидальную волну на холсте, но я не понимаю ее правильно. это мой желаемый вывод, как на картинке.
То, что я до сих пор получил, это http://jsfiddle.net/RaoBurugula/gmhg61s6/4/
HTML
<canvas id="myCanvas" width="360" height="360" style="border:1px solid #d3d3d3;">
JS
 var c = document.getElementById("myCanvas");
 var ctx = c.getContext("2d");
 var i;
 for(i=0; i<360; i+= 20){
    ctx.moveTo(i+5,180);
    ctx.lineTo(i,180);

 }
 ctx.stroke();
 var counter = 0, x=0,y=180;

 //100 iterations
 var increase = 90/180*Math.PI ;
 for(i=0; i<=180; i+=10){

 ctx.moveTo(x,y);
 x = i;
y=  180 - Math.sin(counter);
counter += increase;

ctx.lineTo(x,y);
alert( " x : " + x + " y : " + y) ;
}
ctx.stroke();
Мой желаемый выход

6 ответов
Вы увеличиваете counter со значением, которое это слишком высоко, сделайте это меньшим:
var increase = 90/180*Math.PI / 9;
Нарисуйте всю ширину диаграммы вместо половины:
for(i=0; i<=360; i+=10){
Вам нужна более высокая амплитуда:
y = 180 - Math.sin(counter) * 120;
Старый вопрос, но представляющий очень универсальный интерес.
Все ответы здесь очень полезны, но ни один из них не содержит хорошо прокомментированного кода, поэтому я создал фрагмент, который объясняет, что происходит в каждой точке, и рисует множество переменных для ясности. Спасибо всем за то, что помогли мне понять, я надеюсь, что это поможет кому-то еще.
var c = document.getElementById("canvas"); // Grab canvas object
var ctx = c.getContext("2d"); // Define canvas context
var w=c.width; // Canvas width => Frequency is relative to this
var h=c.height/2; // Canvas height over two => Amplitude: Volume
var f=1; // How many cycles per canvas width => Frequency: Tone & Speed
// Calculates y position from x
function calcSineY(x) {
 // This is the meat (unles you are vegan)
  // Note that:
  // h is the amplitude of the wave
  // x is the current x value we get every time interval
  // 2 * PI is the length of one cycle (full circumference)
  // f/w is the frequency fraction
 return h - h * Math.sin( x * 2 * Math.PI * (f/w) );
}
function drawSine(x){
 ctx.clearRect(0, 0, w, h*2);
  //draw x axis
  ctx.beginPath(); // Draw a new path
  ctx.strokeStyle = "green"; // Pick a color
  ctx.moveTo(0,h); // Where to start drawing
  ctx.lineTo(w,h); // Where to draw to
  ctx.stroke(); // Draw

  // draw horizontal line of current amplitude
  ctx.beginPath(); // Draw a new path
  ctx.moveTo(0,h); // Where to start drawing
  ctx.strokeStyle = "gray"; // Pick a color
  for(var i=0;i<x;i++){ // Loop from left side to current x
    var y = calcSineY(x); // Calculate y value from x
   ctx.moveTo(i,y); // Where to start drawing
    ctx.lineTo(x,y); // Where to draw to
  }
  ctx.stroke(); // Draw

  // draw amplitude bar at current point
  ctx.beginPath(); // Draw a new path
  ctx.strokeStyle = "red"; // Pick a color
  for(var i=0;i<x;i++){ // Loop from left side to current x
    var y = calcSineY(x); // Calculate y value from x
   ctx.moveTo(x,h); // Where to start drawing
    ctx.lineTo(x,y); // Where to draw to
  }
  ctx.stroke(); // Draw

  // draw area below y
  ctx.beginPath(); // Draw a new path
  ctx.strokeStyle = "orange"; // Pick a color
  for(var i=0;i<x;i++){ // Loop from left side to current x
    if(i/3==Math.round(i/3)) { // Draw only one line each 3 pixels
      var y = calcSineY(i); // Calculate y value from x
      ctx.moveTo(i,h); // Where to start drawing
      ctx.lineTo(i,y); // Where to draw to
    }
  }
  ctx.stroke(); // Draw

  // draw sin curve point to point until x
  ctx.beginPath(); // Draw a new path
  ctx.strokeStyle = "black"; // Pick a color
  for(var i=0;i<x;i++){ // Loop from left side to current x
    var y = calcSineY(i); // Calculate y value from x
    ctx.lineTo(i,y); // Where to draw to
  }
  ctx.stroke(); // Draw
}
// Define initial value of x positiom (leftmost side of cnanvas)
var x=0;
// Start time interval
var interval = setInterval(function(){
 drawSine(x); // Call draww function every cycle
 x++; // Increment x by 1
 if(x>w){
     x=0; // x cannot be more than canvas with, so back to 0
        f++; // increment frequency for demonstration
    }
},10); // Loop every 10 milliseconds
<canvas id="canvas" width="320" height="120" style="border:1px solid #999;">Использование bezierCurveTo, это только пример, вы должны настроить параметры, чтобы получить хорошую синусоиду
var c = document.getElementById("myCanvas");
var ctx = c.getContext("2d");
ctx.moveTo(50,50);
ctx.bezierCurveTo(120,-100,200,250,250,50);
ctx.bezierCurveTo(300,-100,350,250,430,50);
ctx.lineWidth = 5;
ctx.strokeStyle = '#003300';
ctx.stroke();
<canvas id="myCanvas" width="550" height="360" style="border:1px solid #d3d3d3;">Основываясь на ответе Барти:
const l = 100; // length
const tf = l * 2 / 5; // two fifths of length

const ctx = document.getElementById("canvas").getContext("2d");
ctx.translate(20, 40); // just for display

ctx.moveTo(0,0);
ctx.bezierCurveTo(tf,-(l-tf),l-tf,l-tf,l,0);

ctx.lineWidth = 2;
ctx.stroke();
<canvas id="canvas" width="200" height="100">Ваш код излишне сложен. Попробуйте это так просто:
var c = document.getElementById("myCanvas");
var ctx = c.getContext("2d");

for(x=0; x<360; x += 20){
    ctx.moveTo(x+5,180);
    ctx.lineTo(x,180);
}
ctx.moveTo(0,180);

for(x=0; x<=360; x+=1){
    y = 180.0 - Math.sin(x*Math.PI/180)*120;
    ctx.lineTo(x,y);
}
ctx.stroke();
         function plotSine(amplitude, frequency) {
  const canvas = document.getElementById('canvas');
  if (canvas.getContext) {
    const ctx = canvas.getContext('2d');

    ctx.clearRect(0, 0, canvas.width, canvas.height);

    ctx.beginPath();

    ctx.strokeStyle = '#343a40';
    ctx.lineWidth = 2;

    var x = 0;
    var y = 0;

    while (x < canvas.width) {
      y = (canvas.height / 2) + amplitude * Math.sin(x / frequency);
      ctx.lineTo(x, y);

      x += 1;
    }

    ctx.stroke();
  }
}

plotSine(40, 20);
         code {
  background-color: #eee;
  border-radius: 3px;
  padding: 0 3px;
}
<canvas id="canvas" width="480" height="360">
<p>
Your browser does not support the <code><canvas></code> element.
</p>
</canvas>
<pre>
var c = document.getElementById("myCanvas");
var ctx = c.getContext("2d");
var i;
var amplitude=90;
var width=c.width;
var xAxis=300;
var step=1;
var frequency=4;
ctx.moveTo(0,250);
ctx.lineTo(width,250);
ctx.stroke();
ctx.beginPath();
ctx.moveTo(0,250);
var c=width/Math.PI/(frequency*2);
for(i=0; i<width; i+=step){
   var x = amplitude * Math.sin(i /c);
  ctx.lineTo(i,250+x);


}
ctx.strokeStyle = '#0096FF';

ctx.stroke();
</pre>
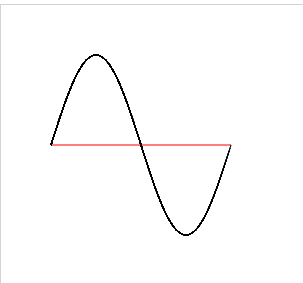
С одной петлей вы можете легко
var c = document.getElementById("myCanvas");
      var ctx = c.getContext("2d");
     var y=180;
      //draw axis
      ctx.beginPath();
      ctx.strokeStyle = "red";
      ctx.moveTo(0,  y/2);
      ctx.lineTo(y,  y/2);
      ctx.stroke();
      // draw sin wave
      ctx.beginPath();
      ctx.moveTo(x,y);
      ctx.strokeStyle = "black";
      for(var x=0; x<=180; x+=1){
          ctx.lineTo(x,((y/2)  + y/2  * Math.sin( ((x+-y/2)/90) * Math.PI)));
          ctx.stroke();
          }
<canvas id="myCanvas" width="360" height="360" style="border:1px solid #d3d3d3;">